Metrics and Analytics of Product Building
These notes were based on the sequoia-data-science series.
Product Evolution
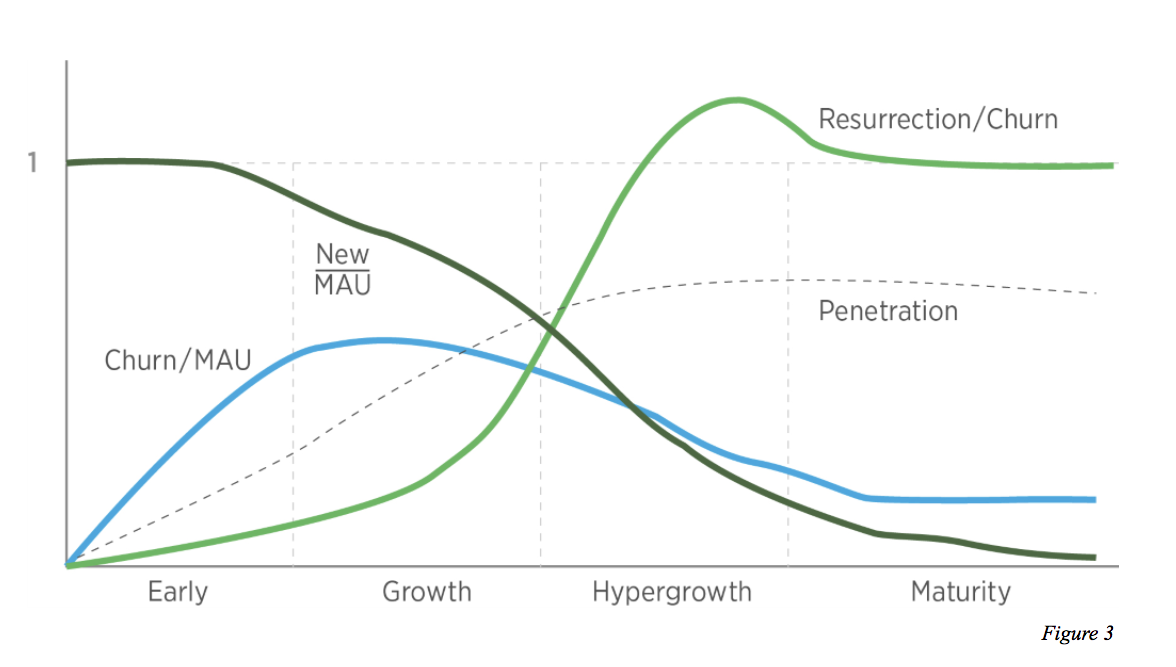
Note: the total number of active users for a given time period is the sum of retention, resurrection and new users.
Your month-over-month net user growth depends entirely on the Quick Ratio: (new users + resurrected users) / churned users.

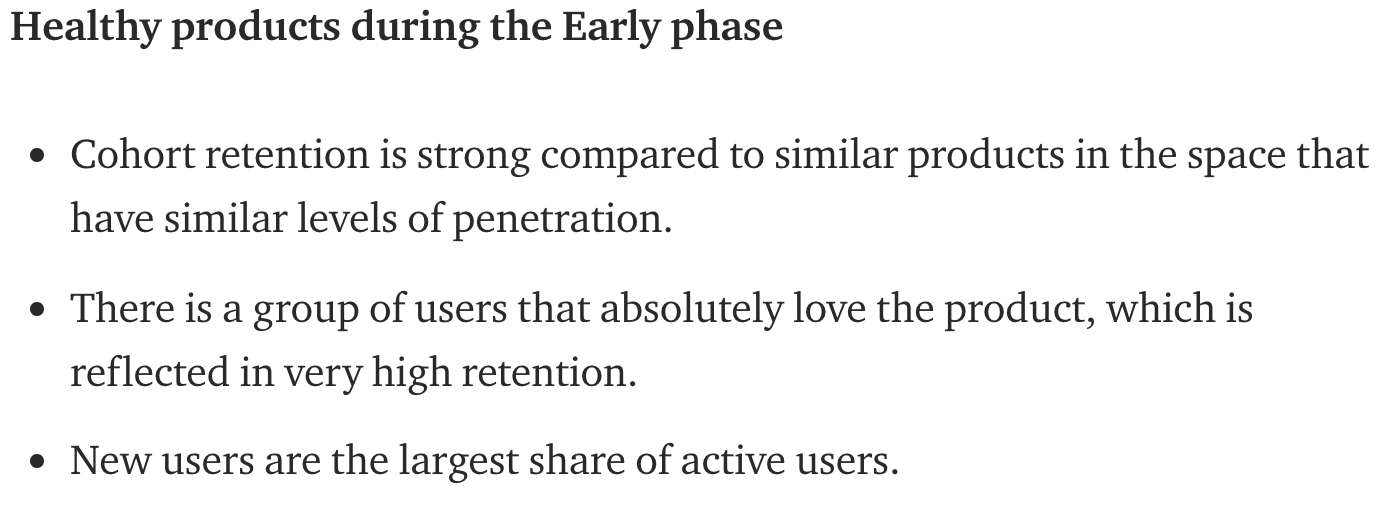
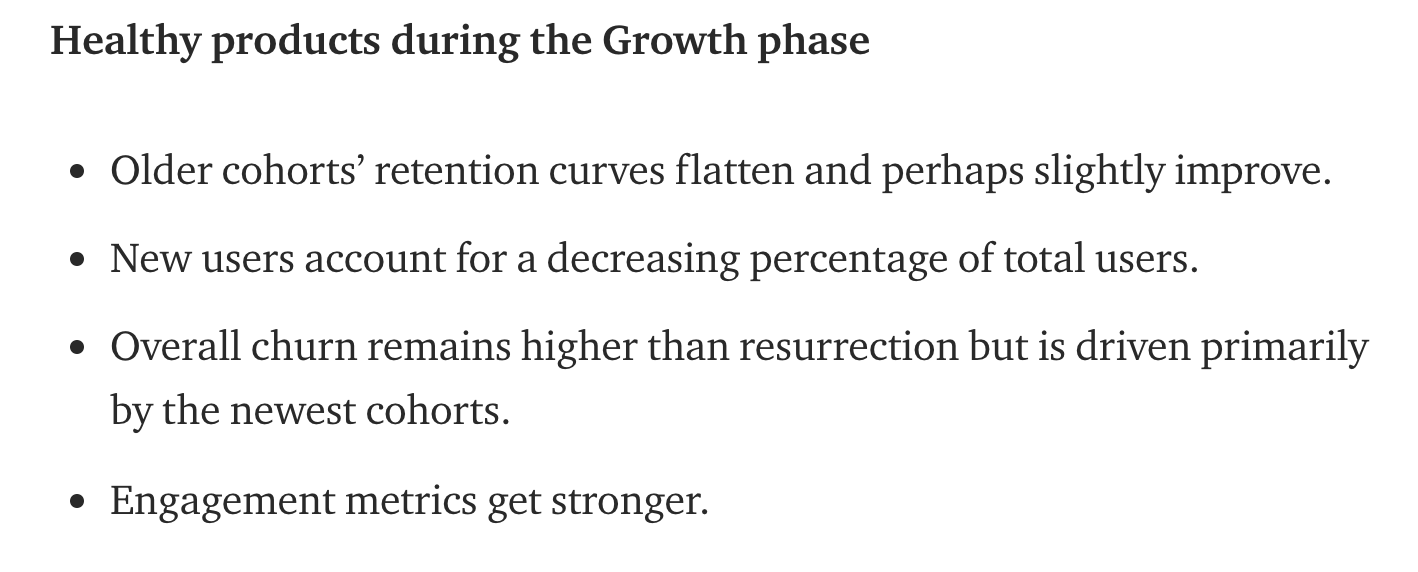
Early on, churn far exceeds resurrection; this gap gradually narrows as the curves level out. (Note: for a weak product, the curves will not flatten out and will eventually reach zero, whereas for a strong product, the curves will begin to rise and will eventually flatten.)
Early stage
In the Early phase, churn far exceeds resurrection and new users contribute significantly to MAU.
Growth stage
Hyper Growth stage

Mature stage
Product Health
Good products grow well as they penetrate their market, retain and engage their users, and bring users back regularly with a healthy content loop.
- Context of overall market
- MAU/installs & installs/overall market
- Growth of product (growth speed, driven source, speed change with penetration)
- MAU/WAU/DAU
- D/D, W/W, M/M, Y/Y changes - (Comparing 28-day rolling windows)
- Quick Ratio = (new + resurrected)/churned
- New users/MAU
- Sign-ups/installs
- Retention
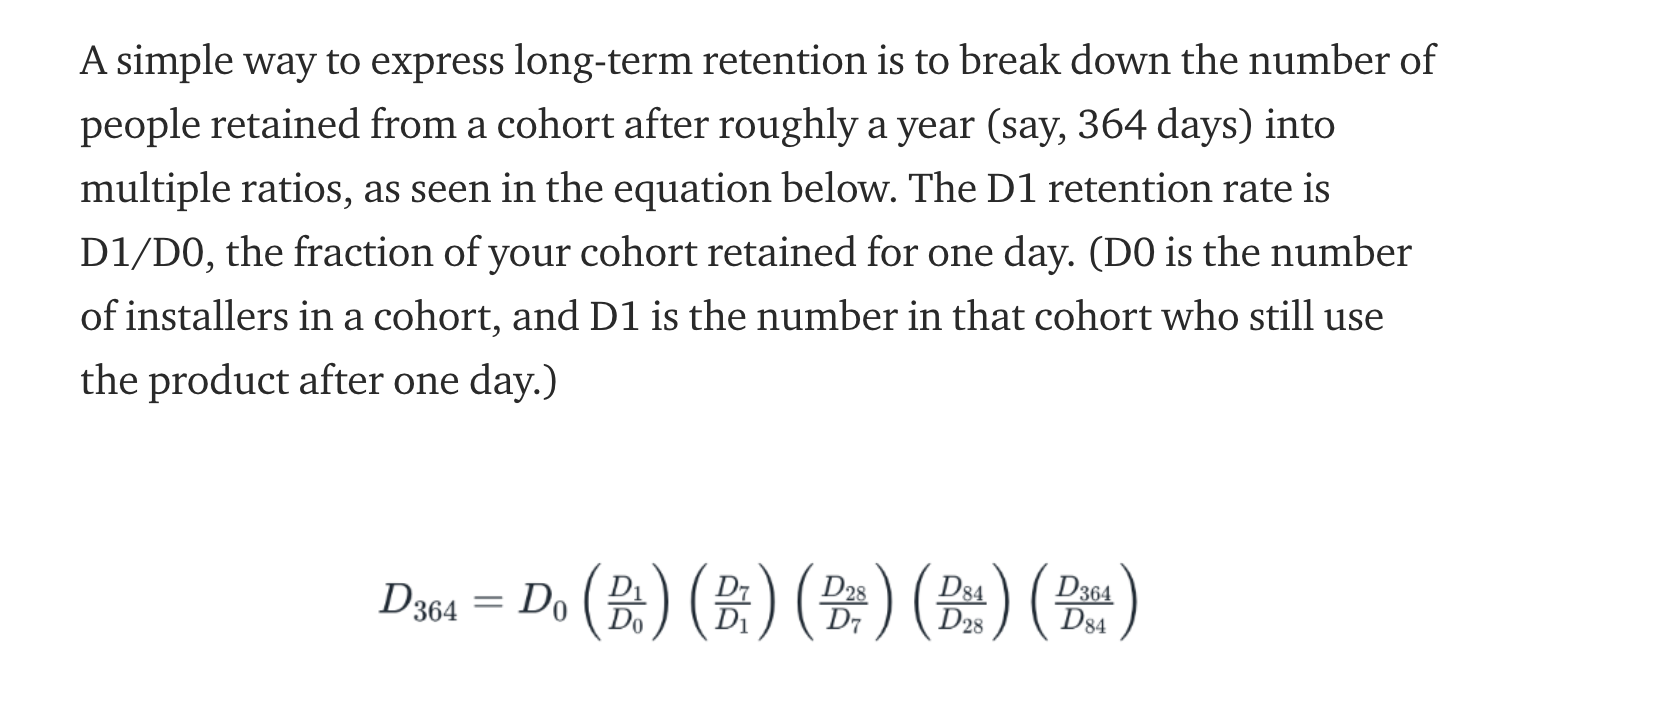
Cohort curves
In addition to Dn retention metrics, analyzing cohort curves is extremely important. Cohort curves will give you a much better idea of whether your retention is flattening, experiencing hyper growth or dropping to zero.
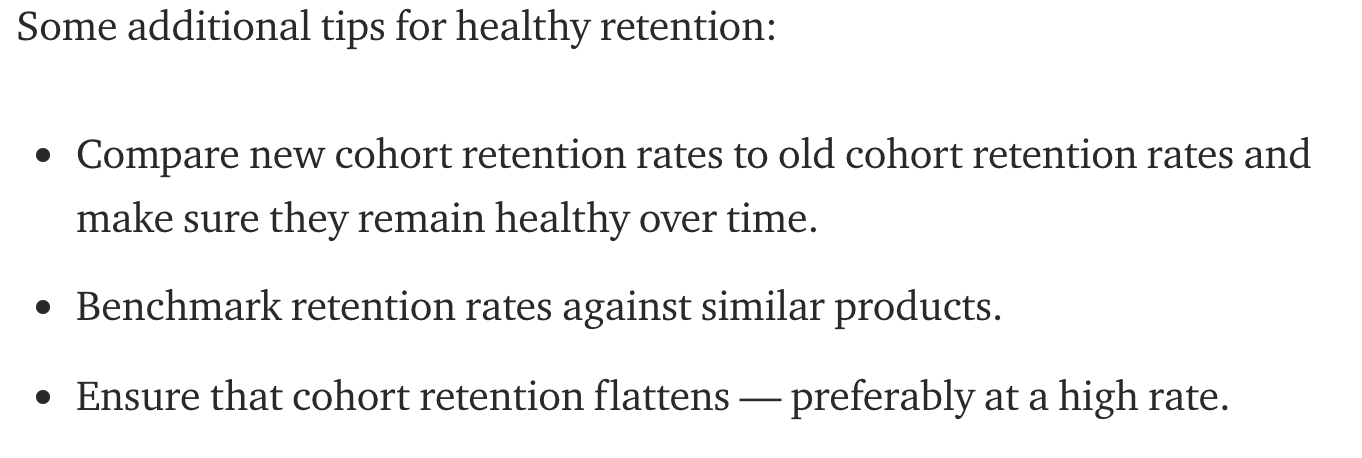
Stickiness
- DAU/MAU
- open rate
- percentage of people who have the product installed that use it in a given time frame
- Lness
- number of days visited in a given time frame. For example, L5+/7 is the percentage of people who visit the product at least five times per week.
Engagement
- Time spent/DAU
- Number of Sessions
- Time/session
- Inventory available
- number of views
Engagement - considerations
- Possible Segmentation
- leading and lagging indicators(DAU,WAU,MAU)
Retention
Retention is measured relative to two factors: time frames and events.
Triangle retention chart
- Horizontal features identify cohort-specific traits
- Diagonal features are usually a result of product feature releases, news or other events that affect overall usage
- Vertical features are commonly seen in subscription businesses that have annual plans, as well as in those that offer trials.
Change of Metrics
Seasonality:
-
understand your product’s overall ecosystem
- For example, it might be important to know what young people do during the summer, how middle-aged women shop, how people using Android behave compared to those using iOS or who is likely to be an early adopter of your product.
-
Week-over-week movement
- use seven-day (or rolling seven-day) averaging of the metric of interest
-
Day-over-day movement
-
Year-over-year changes
Outside factors(competition etc.):
-
ANALYZING COMPETITION:
- competition generally manifests as churn; while we can identify that people are churning, it is difficult if not impossible to know whether people are leaving for a competitor without user experience (UX) research.
-
ANALYZING EVENTS:
-
ANALYZING MACRO TRENDS:Hard to detect
Behavioral Changes:
“Mix” has multiple meanings, and is sometimes known as Simpson’s Paradox. A company’s “sales mix” is the proportion of each product it sells relative to its total sales. Similarly, “user population mix” is the proportion of a specific user base (for example, users from a given country) relative to the overall user base.
A change in a mix over time is known as “mix shift.”
- Pure Mix Shift:
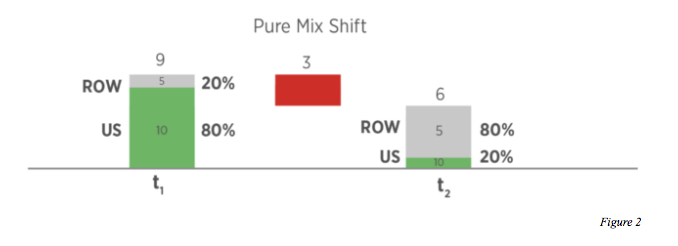
- even if there is no change in product nor in individual users’ engagement, mix shift can still drive a decrease in overall engagement.
- Inherent changes in engagement:
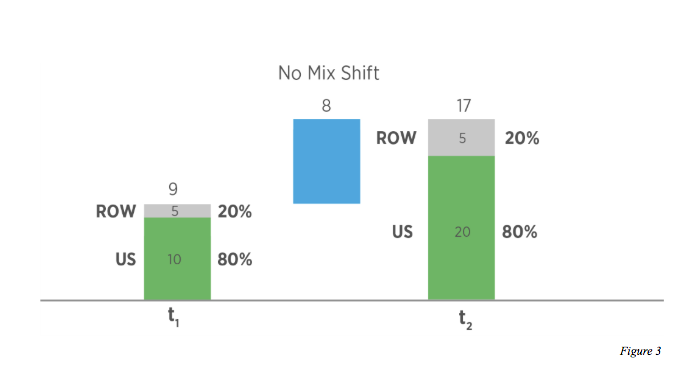
Engagement
- production-consumption framework of user-generated content (e.g., Facebook, Instagram, Snapchat, YouTube)
- professionally generated content(e.g., Netflix, HBO)
- marketplaces like eBay, Amazon and Airbnb
- messaging products like iMessage, WhatsApp and Facebook Messenger
News Feeds
- Content created is inventory, how an individual user’s inventory scales with their number of connections and the total content creation in the system.
- open follow feed
- Time duration
Professionally Generated Content
- Content production can be broken down into three phases: creation, capture and sharing
- Creators type:
- here are four primary categories of creators: friends, pages, groups and news
- Content Sharing:
- content sharing can be understood across multiple dimensions: audience, social acceptability of the content, feedback, perception, content type, format type, product simplicity and permanence of the content.
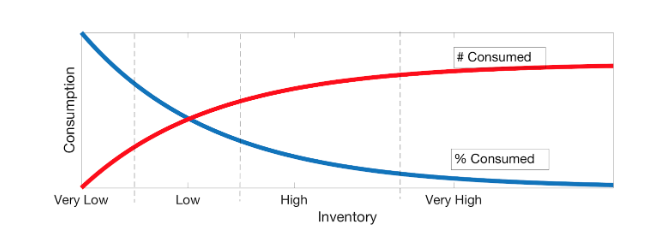
Inventory and consumption:
- Amount of inventory available
- Number of connections
- Consumption of available inventory
- Number of posts consumed
- Percent of users who are inventory constrained
- Increasing the right connections helps drive engagement.
- Identifying needy users and ensuring they have a great experience is paramount to long-term product success.
- Understanding the consumption and availability of inventory for different segments and identifying specific opportunities will help serve them better and thereby improve the overall product.
Marketplace
- Organizations that create value primarily by enabling direct interactions between two (or more) distinct types of affiliated customers. American Express, PayPal, eBay, Uber, Facebook, iPhone, WhatsApp, Netflix, Amazon, and YouTube can all be considered as two-sided marketplaces.
- These platforms exist because there is a need for an intermediary to match the supply and demand sides of the platform in a more efficient way.