Clustering Algorithms and Evaluations
KMeans
What is KMeans? source
- It assigns data points to a cluster such that
the sum of the squared distancebetween the data points and the cluster’s centroid (arithmetic mean of all the data points that belong to that cluster) is at the minimum
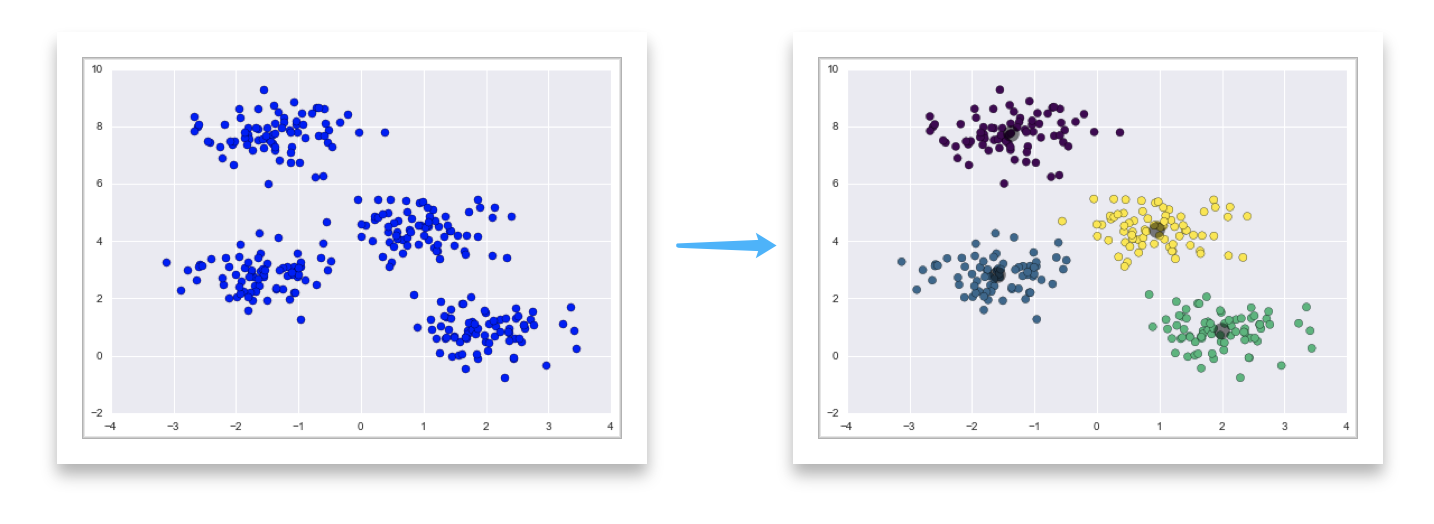
-
K: For this algorithm, we pre-defined that there are K clusters, or to say, K centers.
-
Means: We calculate our centers by calculating means of each cluster.
Process: Visualization
- Guess some cluster centers
- Repeat until converged
- assign points to the nearest cluster center
- set the cluster centers to the mean
Wait..But how does this work? source
- The approach kmeans follows to solve the problem is called
Expectation-Maximization. The E-step is assigning the data points to the closest cluster. The M-step is computing the centroid of each cluster.
The objective function:

Where $w_{ik}=1$ for data point $x_i$ if it belongs to cluster $k$; otherwise, $w_{ik}=0$. Also, $\mu_k$ is the centroid of $x_i$’s cluster.
We first minimize $J$ w.r.t. $w_{ik}$ and treat $\mu_k$ fixed. Then we minimize $J$ w.r.t. $\mu_k$ and treat $w_{ik}$ fixed.
- When $\mu_k$ is fixed, we assign each point to its closest center to reach minimum.

- When $w_{ik}$ is fixed, we recalculate the $\mu_k$ by calculating each cluster’s mean.

How to choose K?
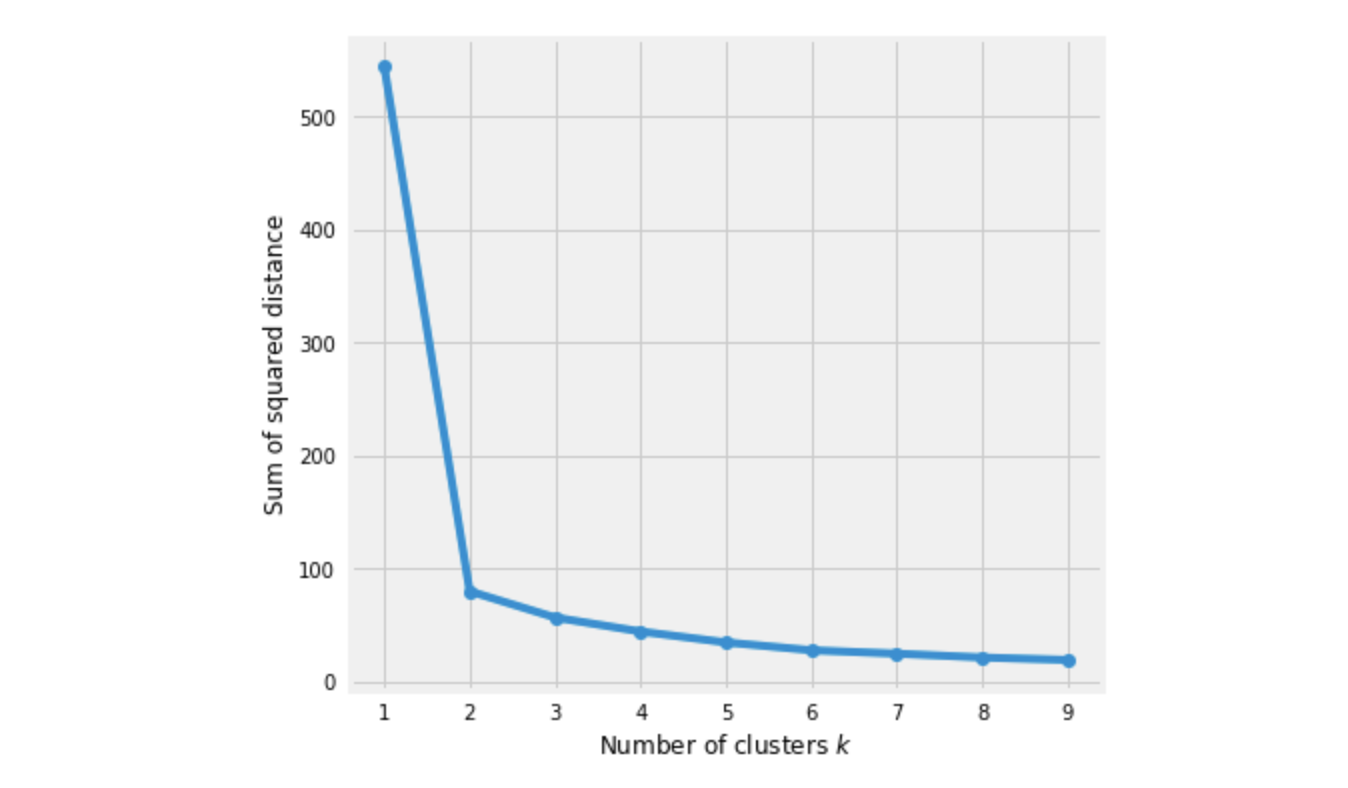
Elbow Method:
We pick k at the spot where SSE starts to flatten out and forming an elbow.
Limitation:
-
Requires pre-knowledge towards the number of clusters.
-
Is limited to linear cluster boundaries
-
The globally optimal result may not be achieved
-
k-means can be slow for large numbers of samples or large number of features
DBSCAN (Density-Based)
What is DBSCAN?source
-
DBSCAN: Density-based spatial clustering of applications with noise.
-
Idea: Clusters are dense regions in the data space, separated by regions of lower object density.
-
Method: Groups together points that are close to each other based on a
distance measurement(usually Euclidean distance) anda minimum number of points. It also marks as outliers the points that are in low-density regions.
Parameters:
-
eps: specifies how close points should be to each other to be considered a part of a cluster.
-
minPoints: the minimum number of points to form a dense region.
How this works?Visualization
-
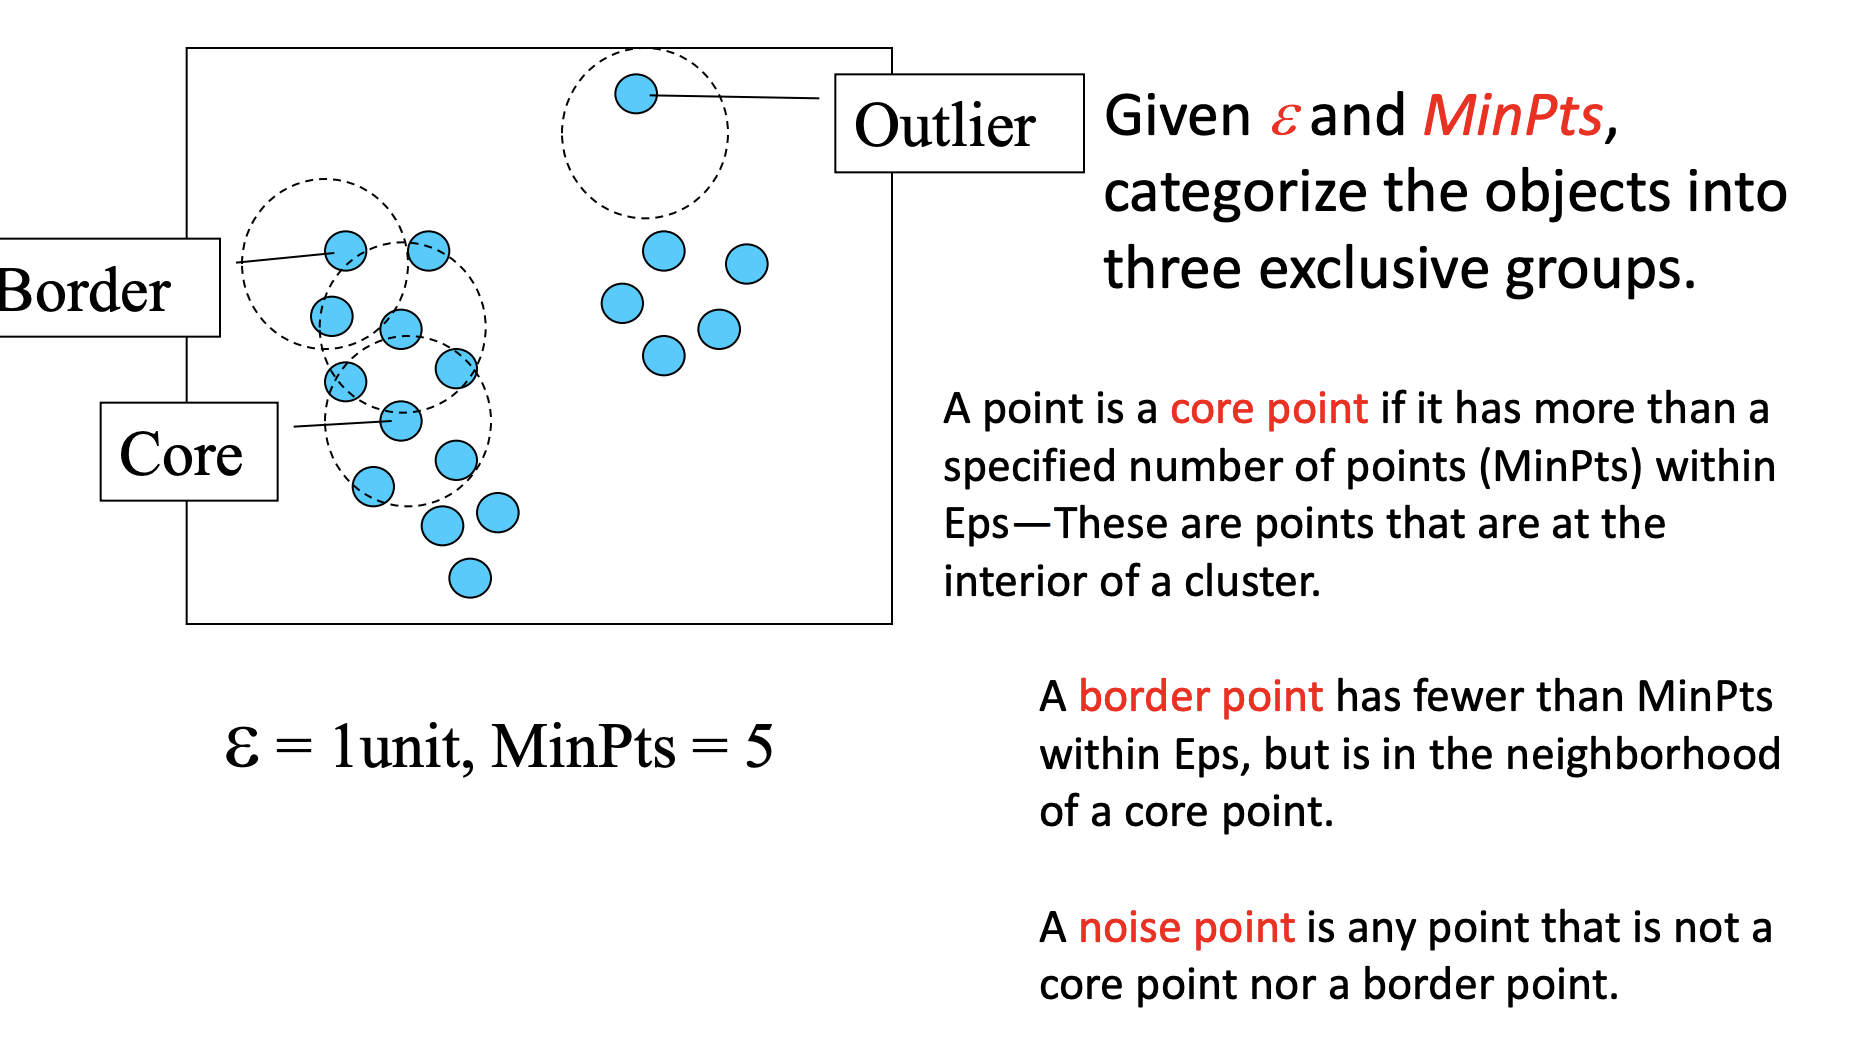
Visit every point(every point is visited once only), check if this point satisfies “the number of points in the circle with radius of eps is greater or equal to minPoints”.
-
If Yes: check if this point is already in some cluster. If yes, this point and all the neighbors are marked as in this cluster; If No, then create a new cluster. Then visit all the neighbors and check the condition again.
-
If No: mark this point as outlier.
-
How to choose parameters?
-
MinPts: As a rule of thumb, a minimum minPts can be derived from the number of dimensions D in the data set, as minPts ≥ D + 1
-
The value for $\epsilon$ can then be chosen by using a k-distance graph, plotting the distance to the k = minPts-1 nearest neighbor ordered from the largest to the smallest value. Good values of $\epsilon$ are where this plot shows an “elbow”.
Advantage:
-
No need to specify number of clusters in advance
-
Can handle non-regular shapes of clusters.
Limitation:
-
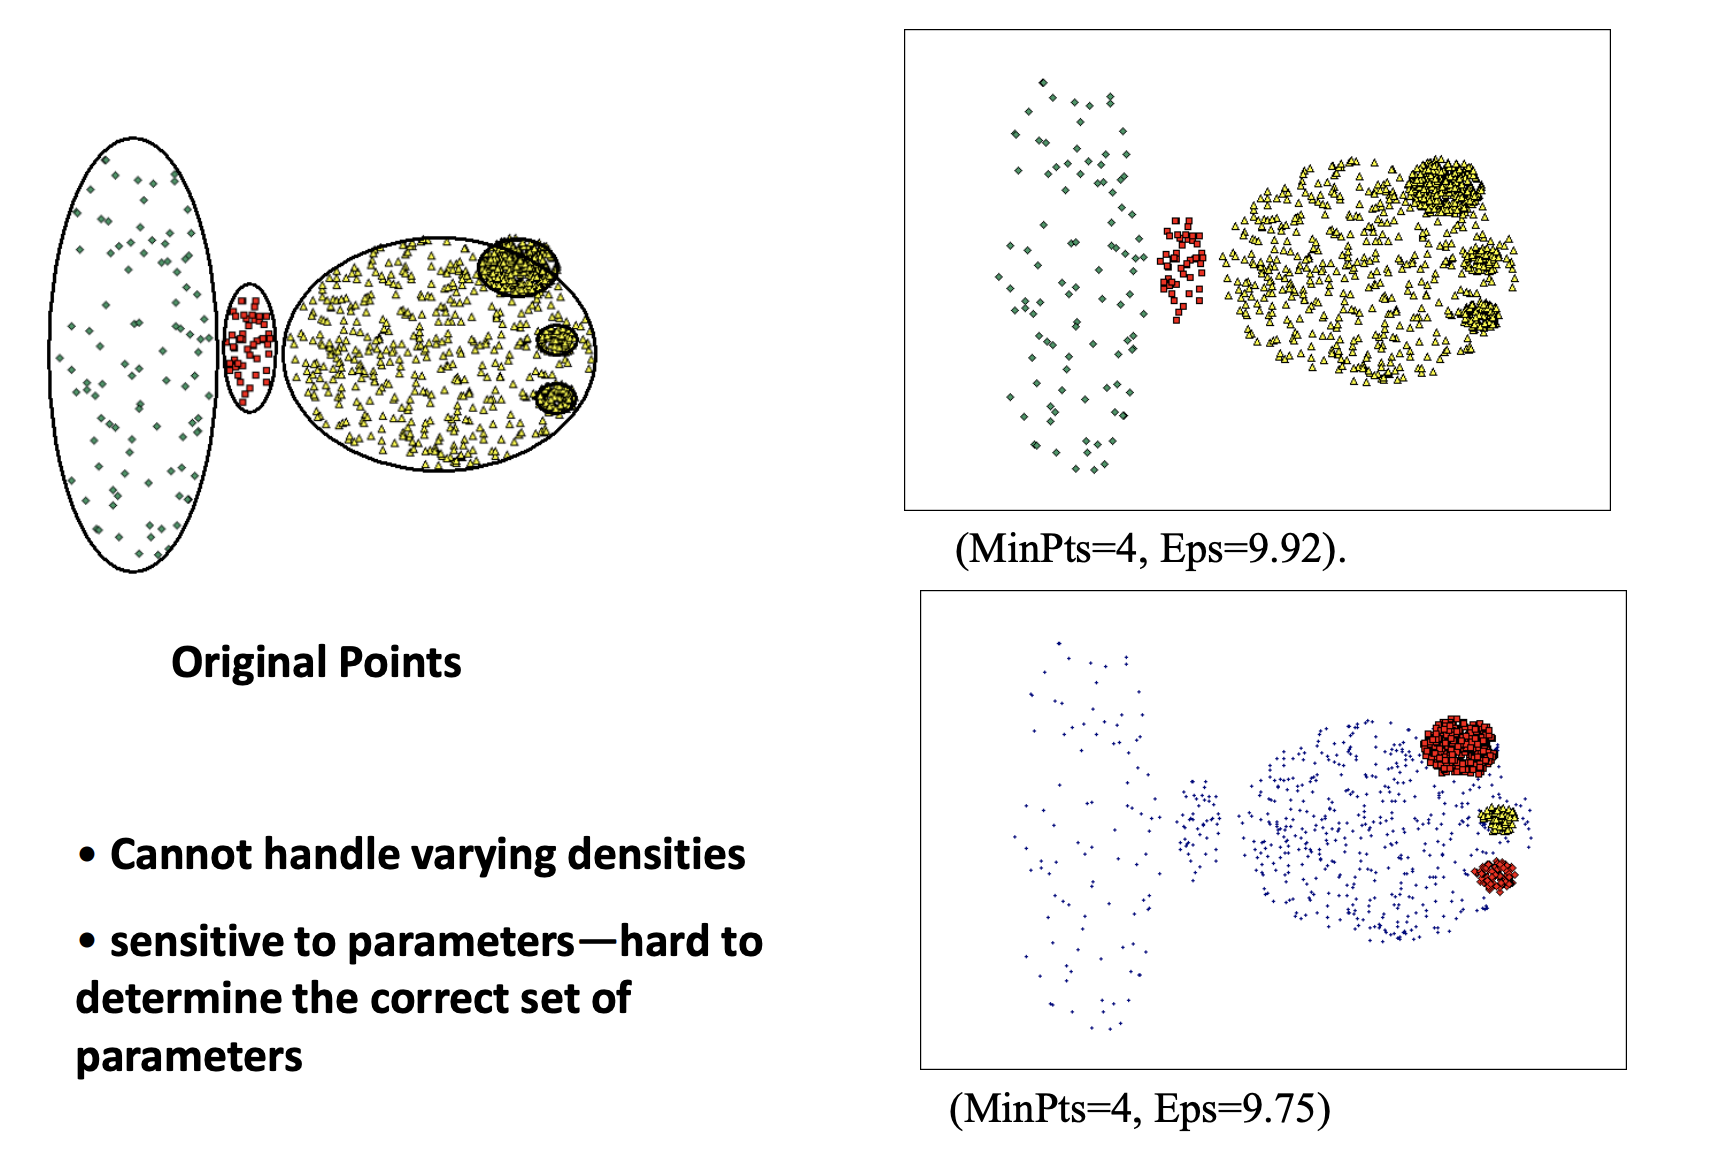
Sensitive to parameters
-
Cannot handle varying densities
-
Not entirely deterministic: border points that are reachable from more than one cluster can be part of either cluster
-
Choose parameters can be hard.
-
Curse of dimensionality
Hierarchical Clustering
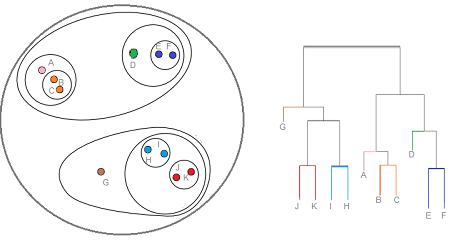
Method of cluster analysis which seeks to build a hierarchy of clusters
Type:
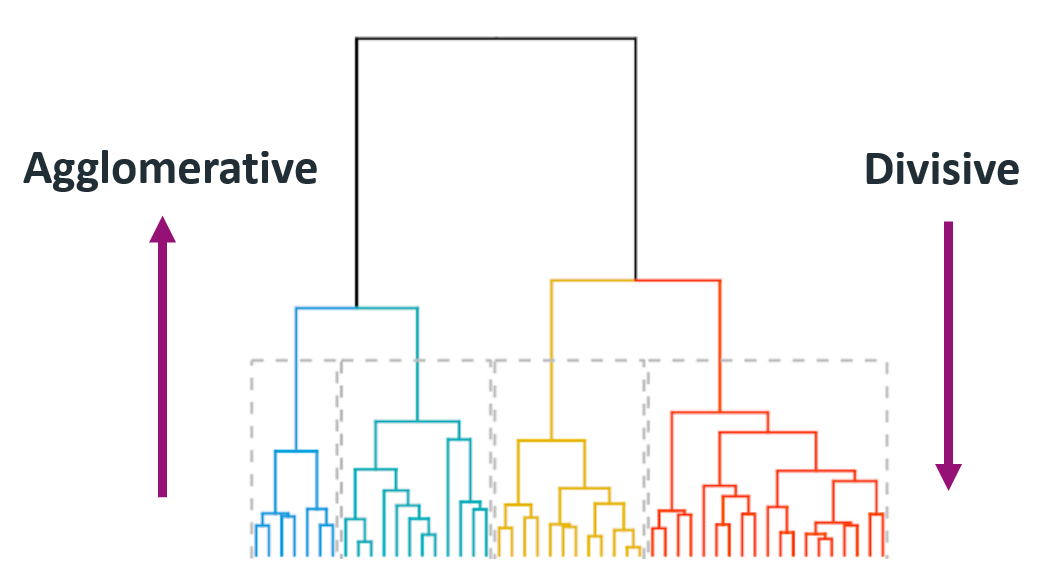
- Agglomerative: This is a “bottom-up” approach: each observation starts in its own cluster, and pairs of clusters are merged as one moves up the hierarchy.
- Divisive: This is a “top-down” approach: all observations start in one cluster, and splits are performed recursively as one moves down the hierarchy.
How?
-
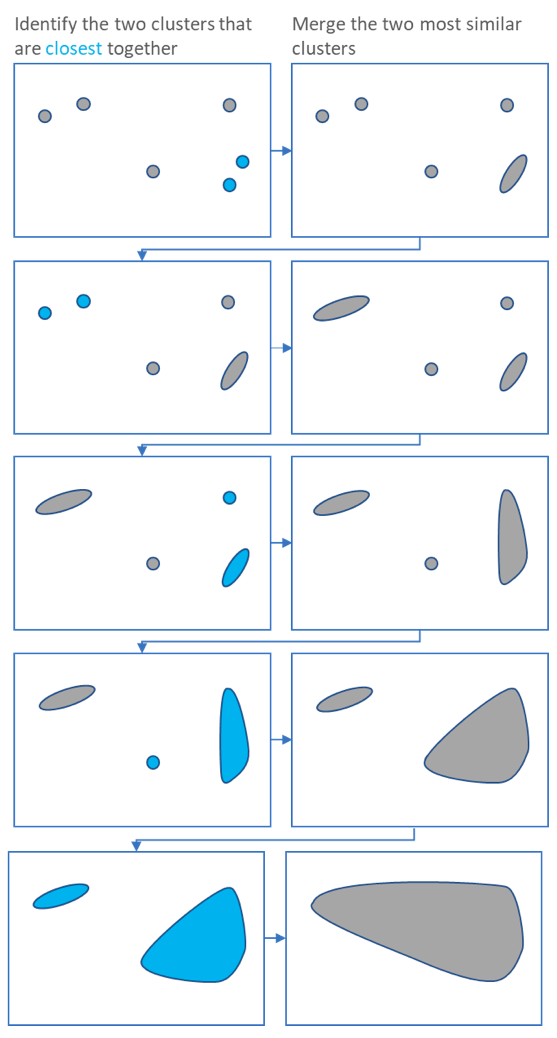
Initially, every point is a seperate cluster
-
Iterate until all points in one cluster:
- identify the two clusters that are closest together
- merge the two most similar clusters
Distance:
- Usually Euclidean distance
Linkage:

Gaussian Mixture Models
Clustering Evaluation
Why evaluation? : to compare different algorithms, to choose best parameters. source
External measures for clustering evaluation
- External: assume that ground truth is known.
Matching-based measures
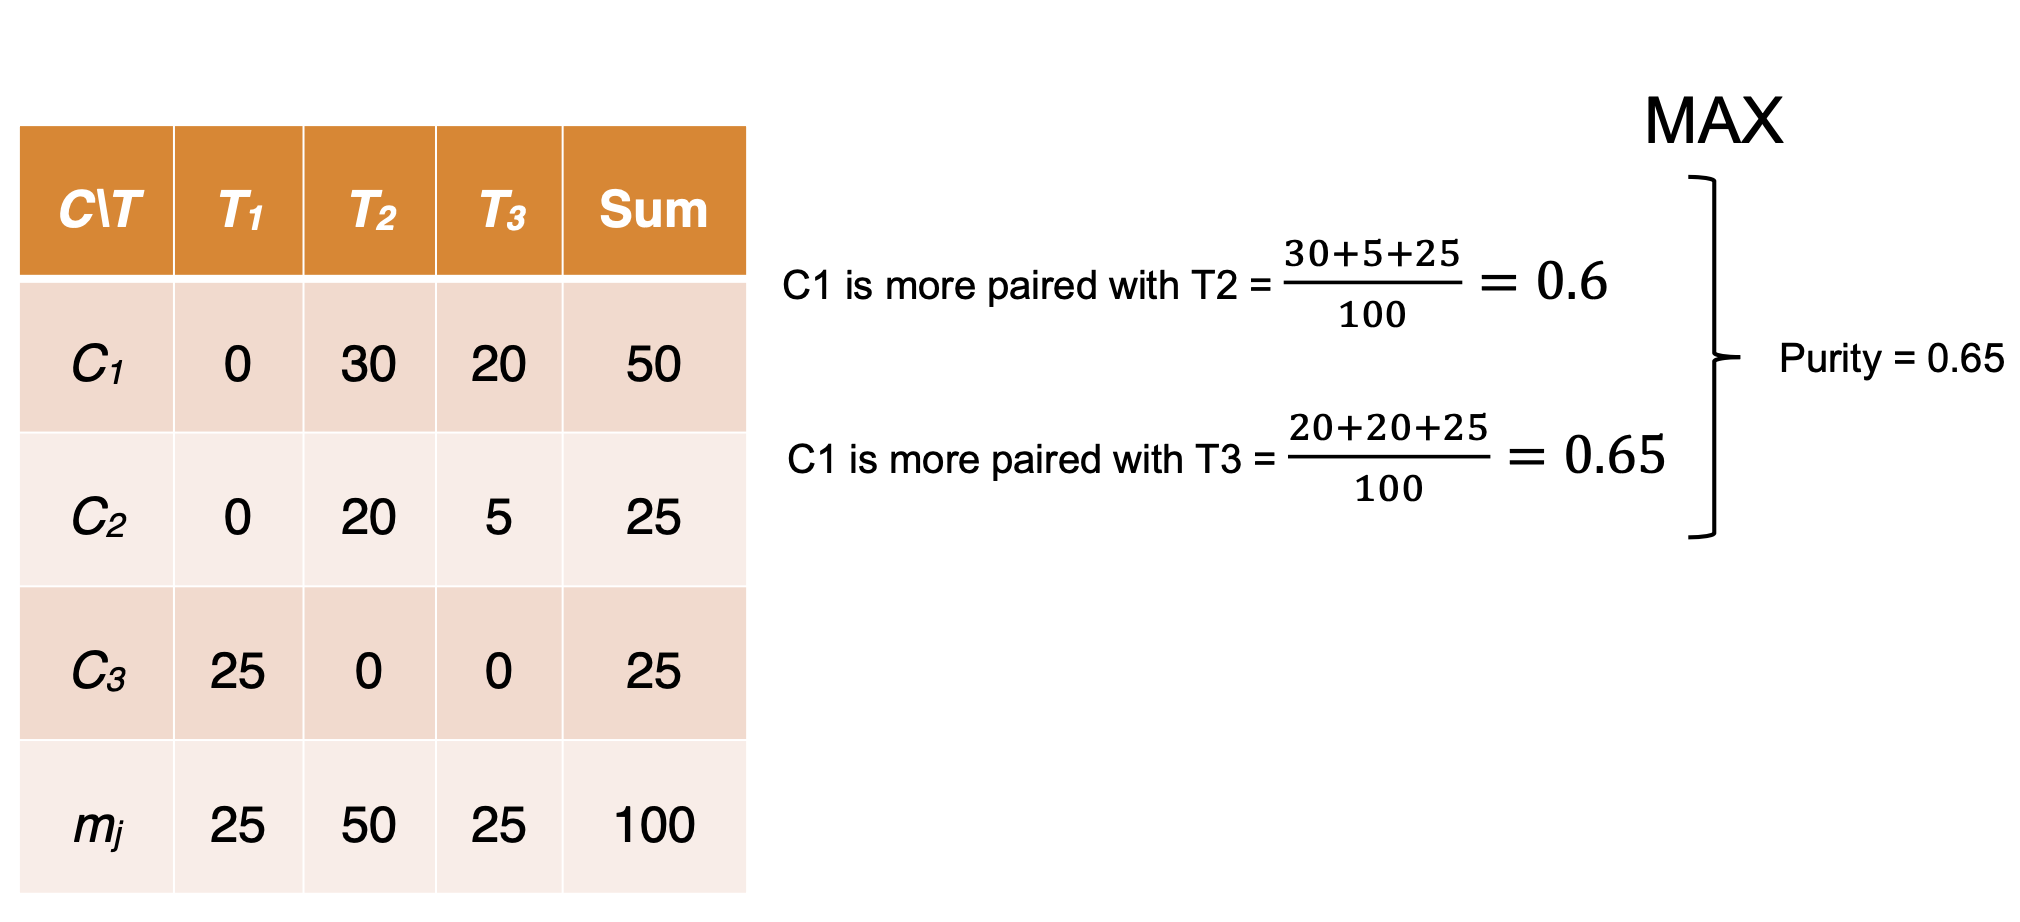
- Purity: Quantifies the extent that cluster Ci contains points only from one (ground truth) partition
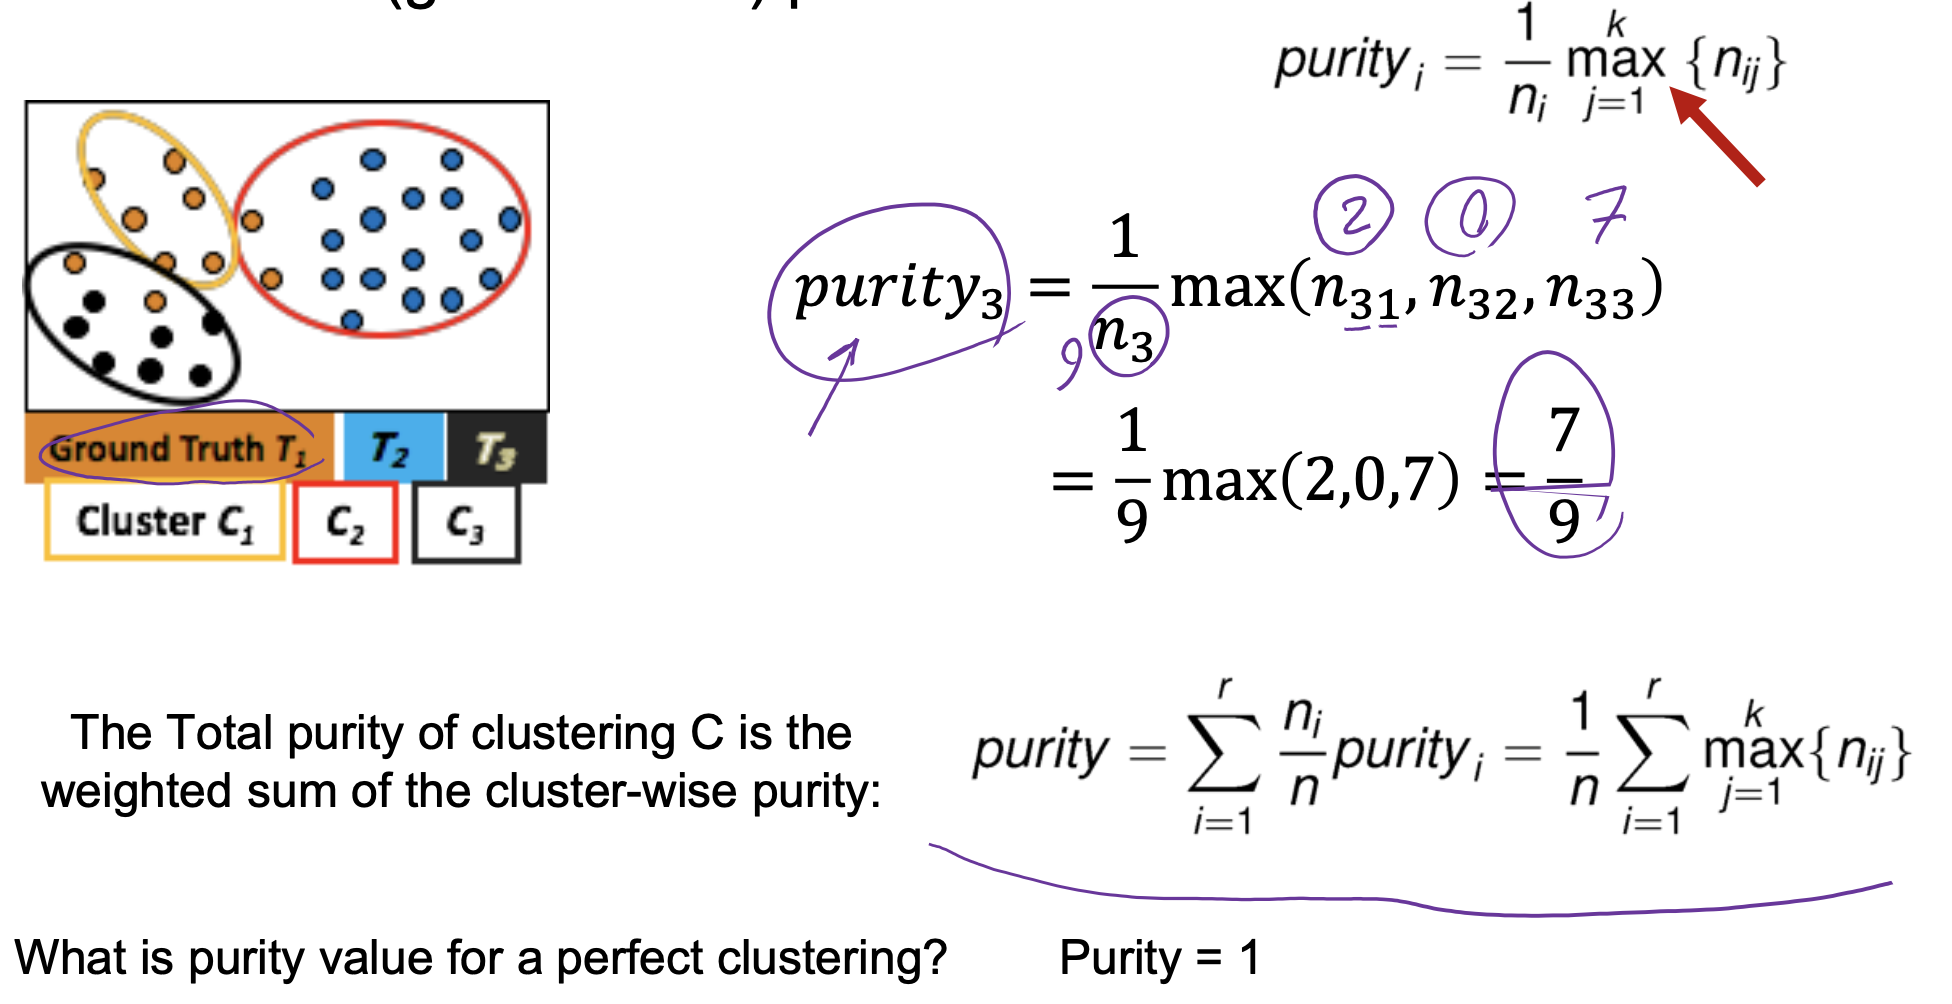
- Drawback of purity: two clusters may be matched to the same partition.
- Maximum Matching: the maximum purity under the one-to-one matching constraint.
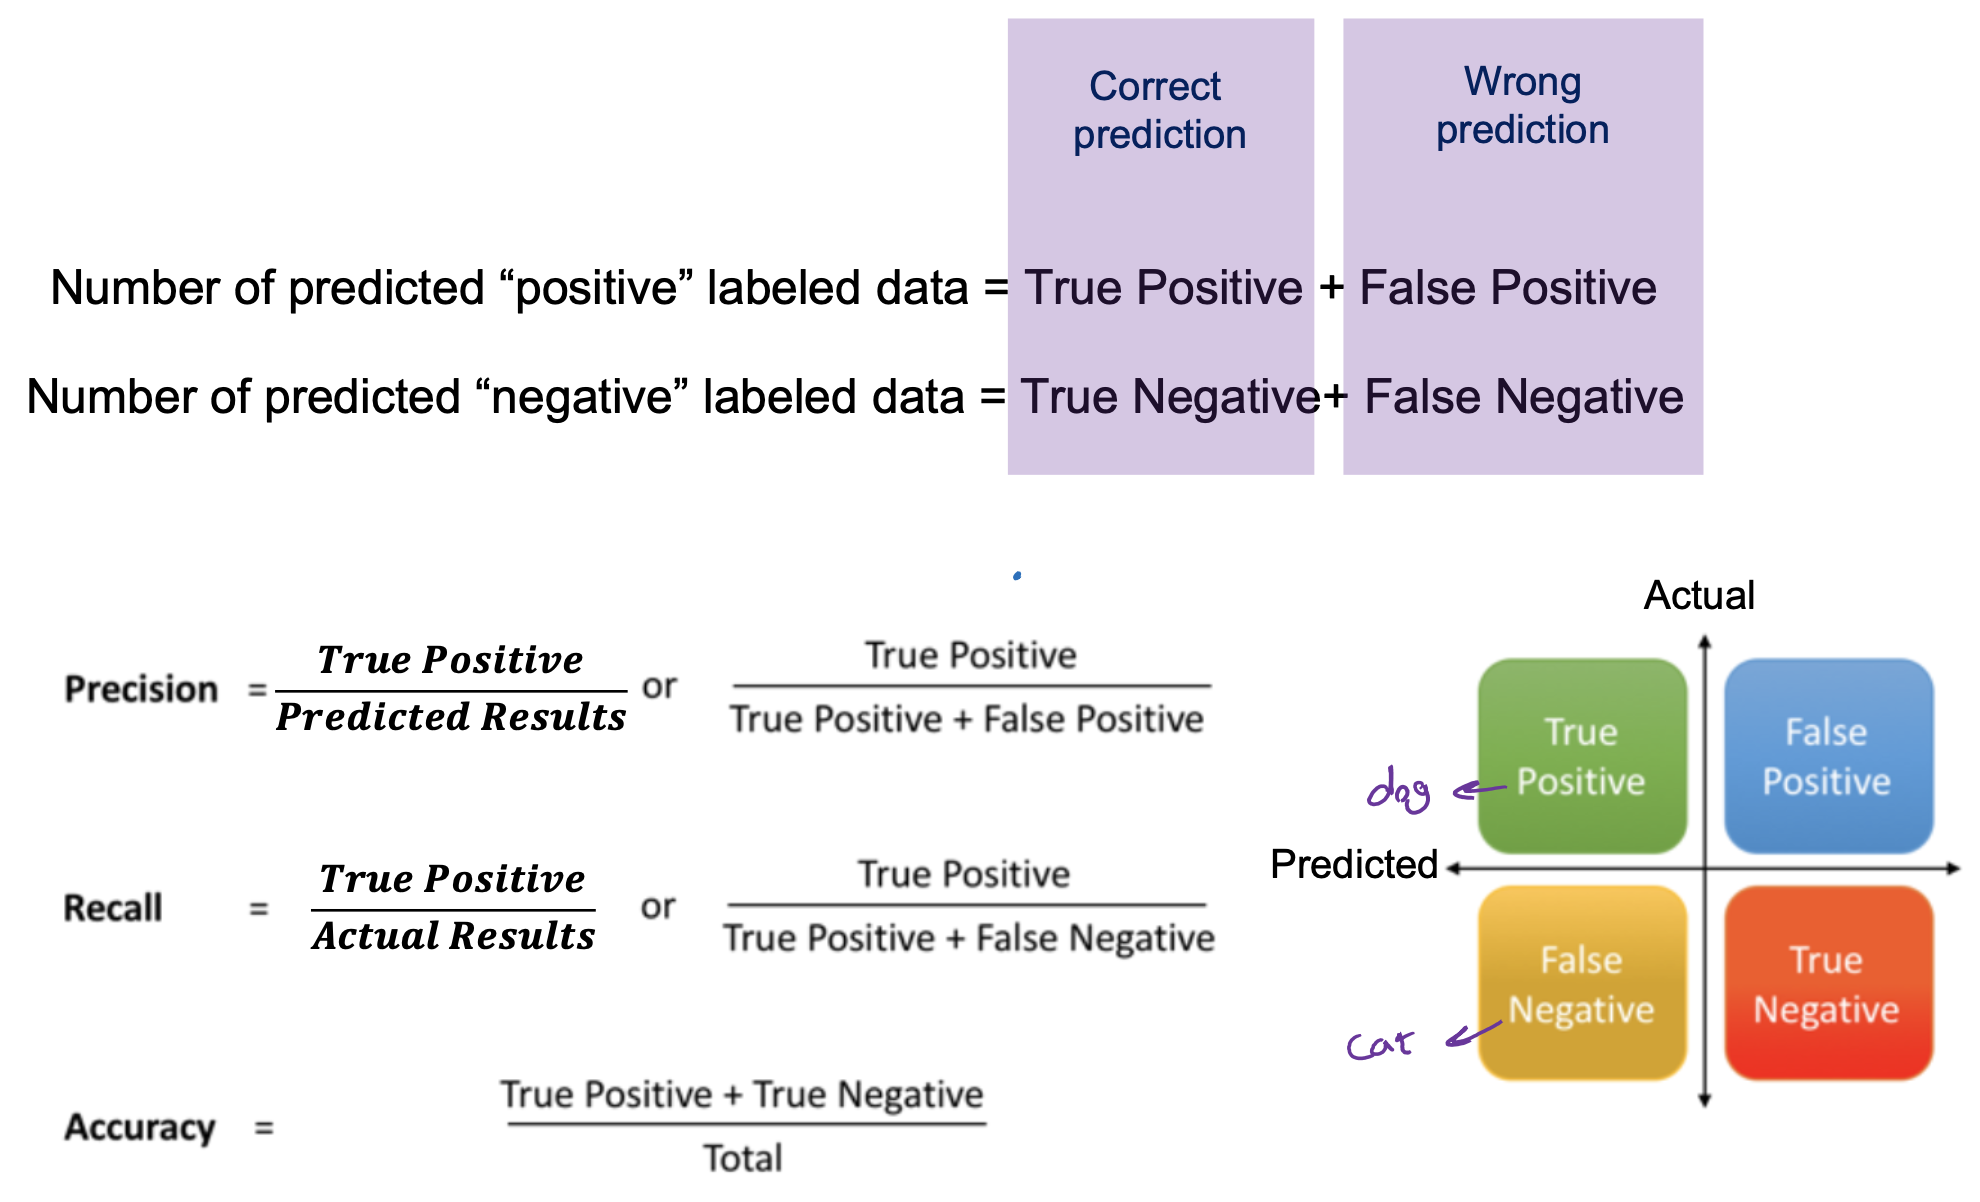
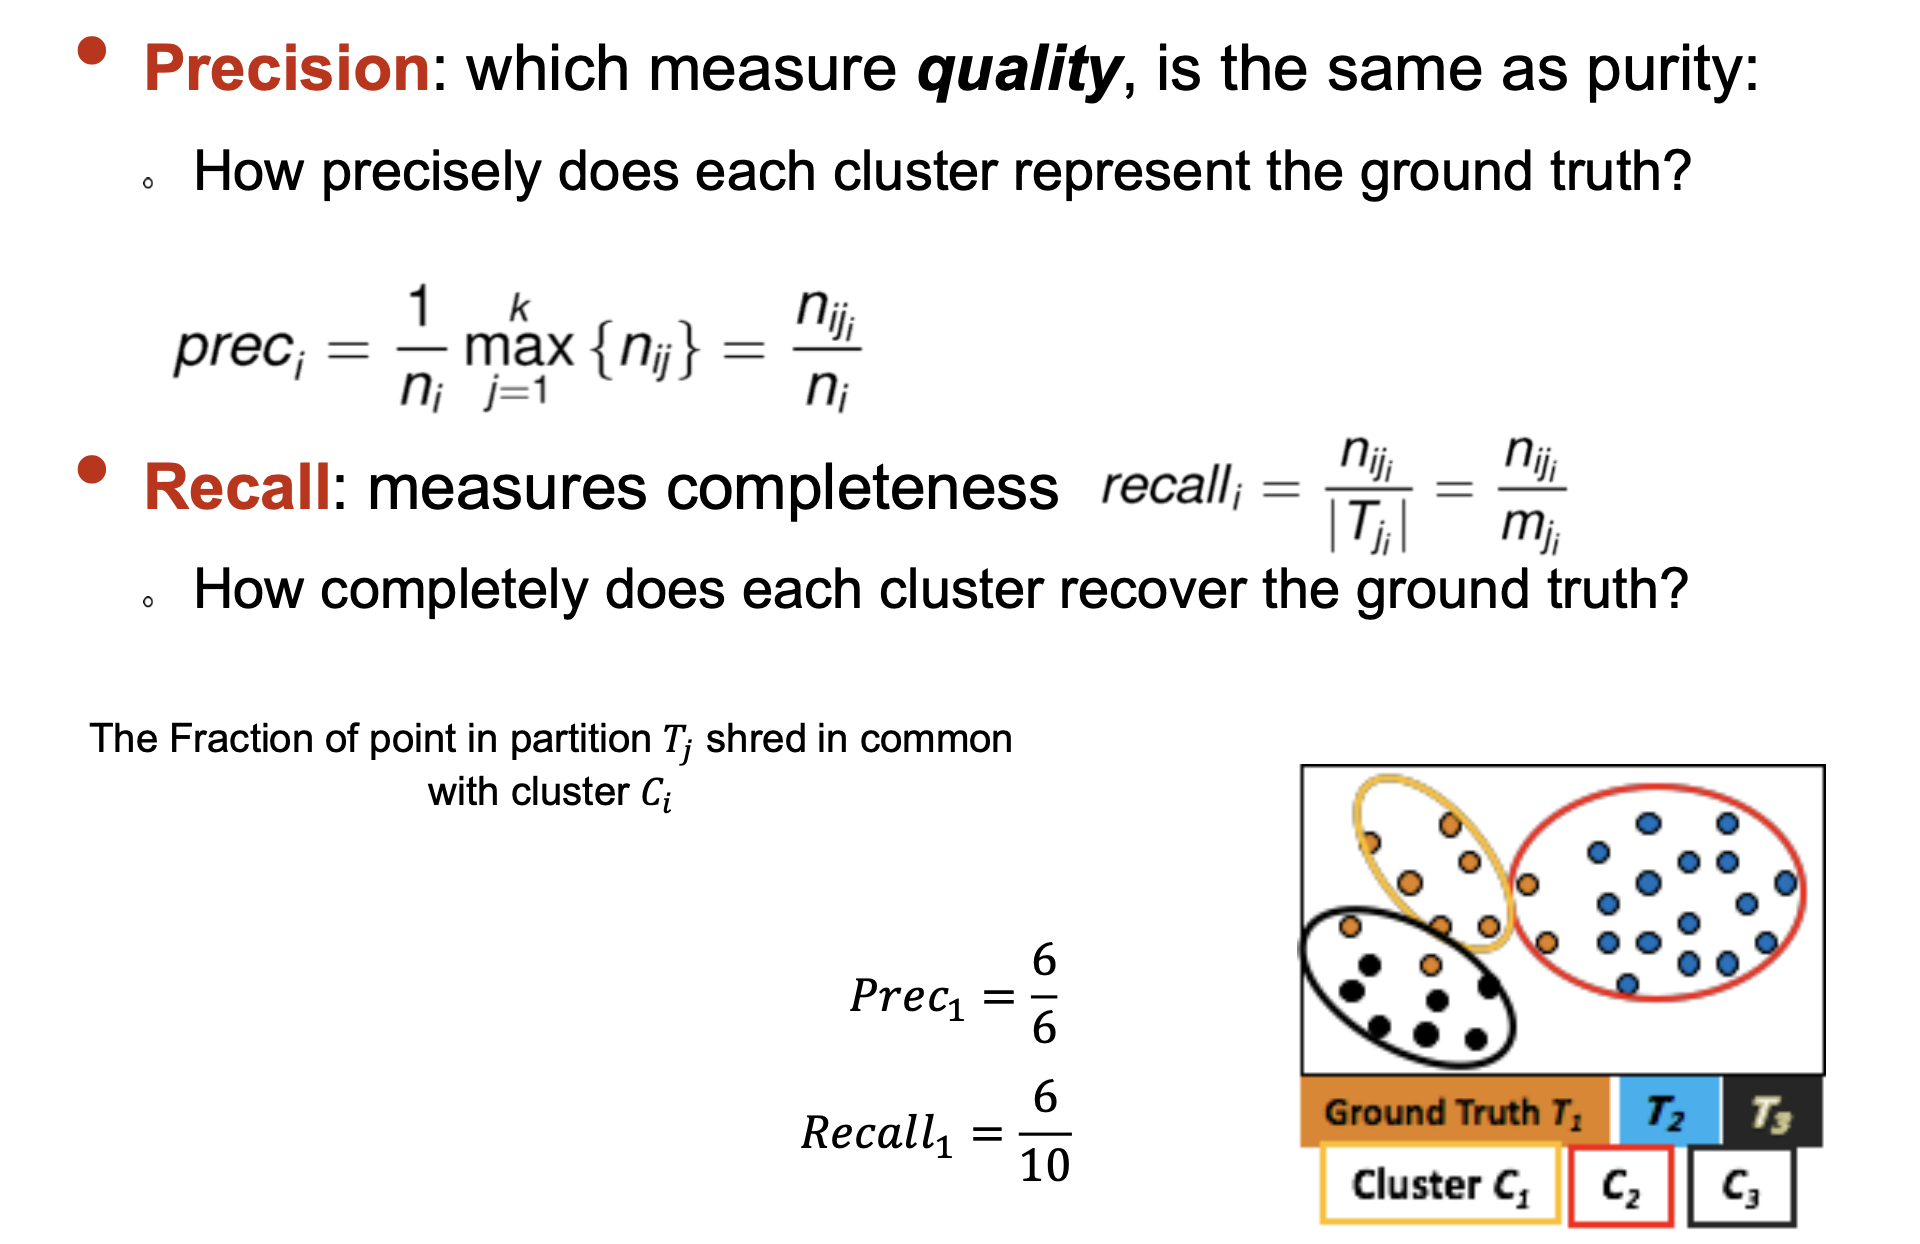
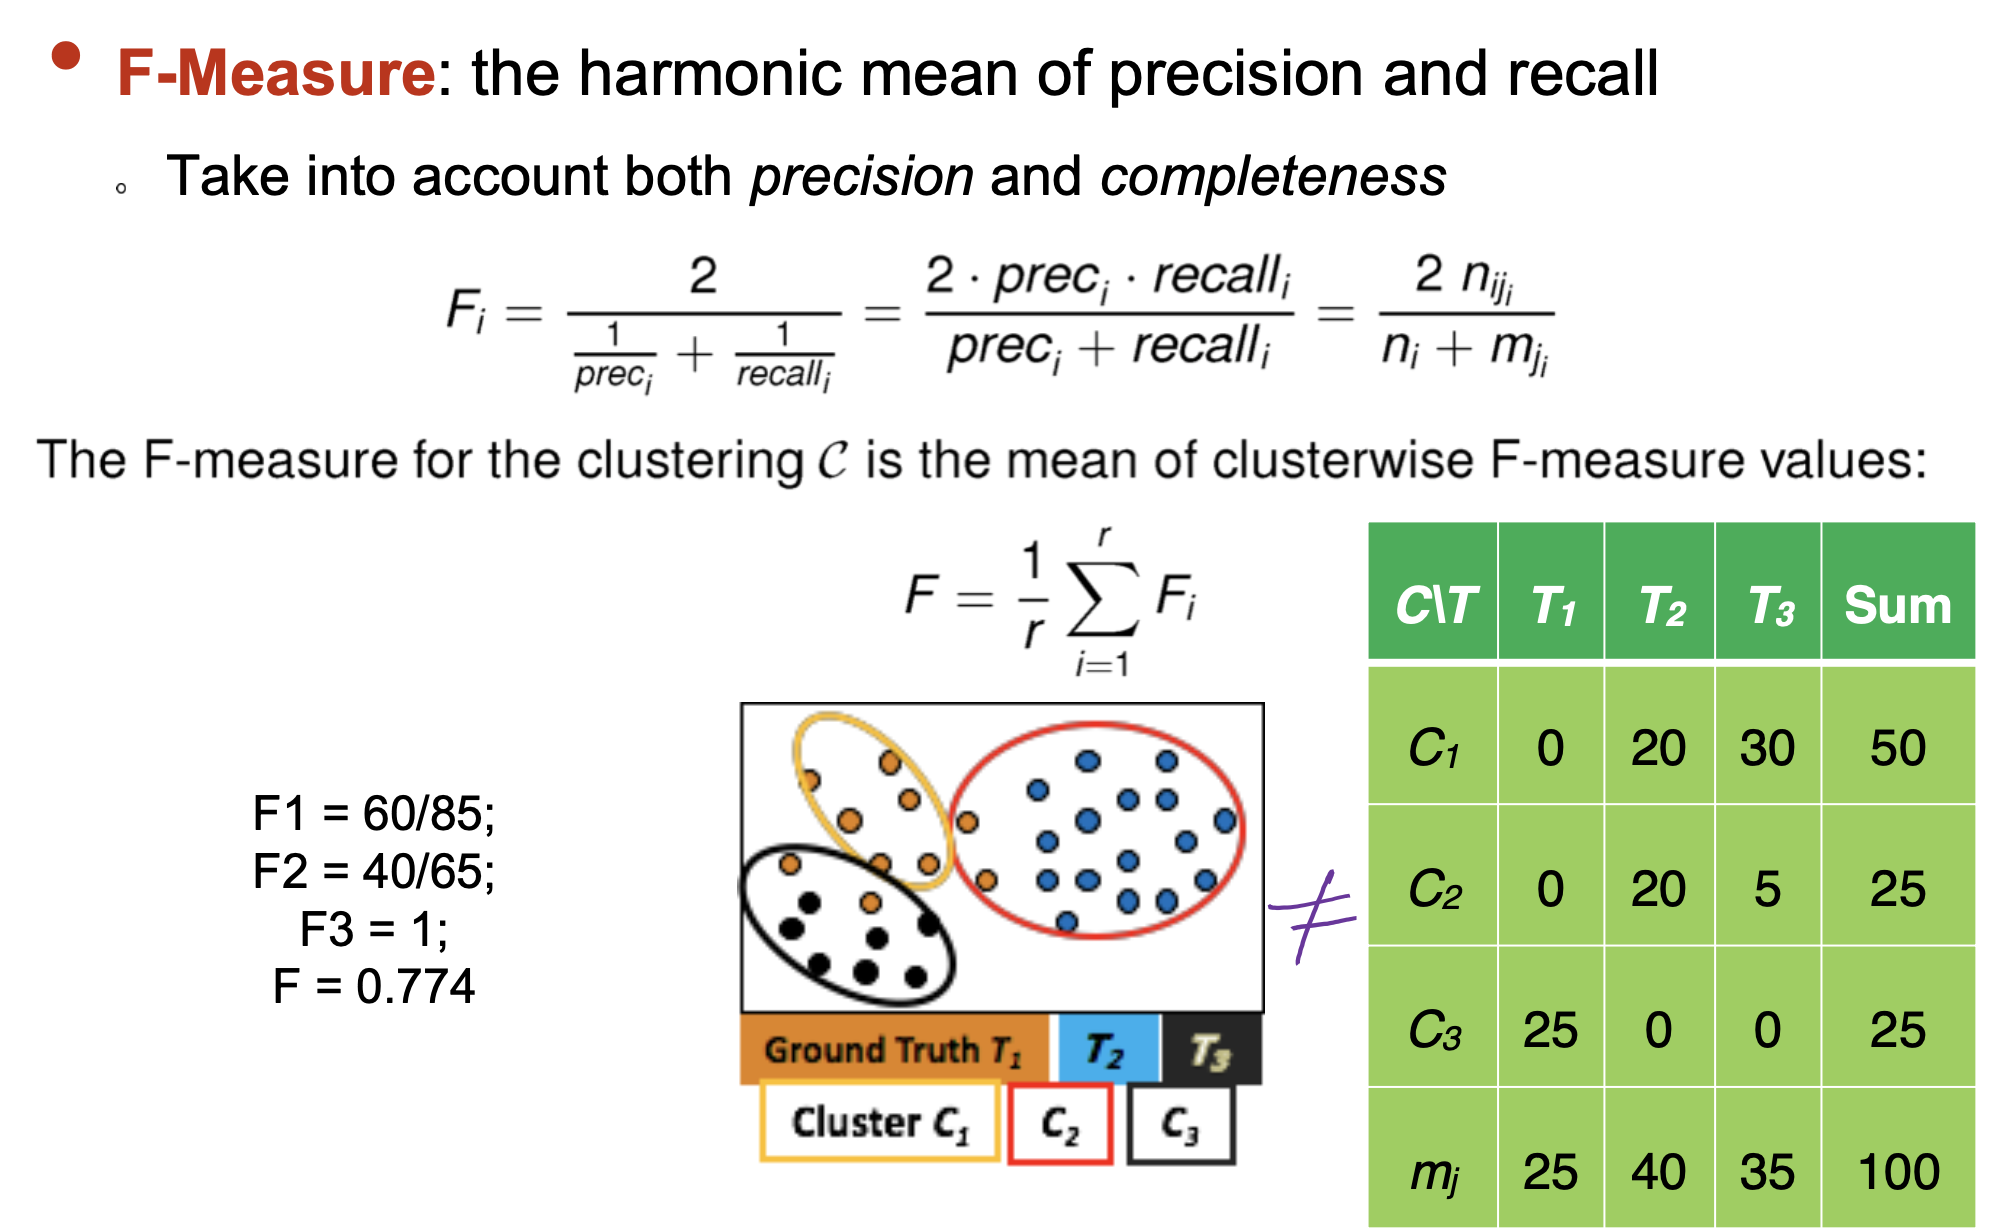
- F-Measure
Let’s review
Entropy-based measures
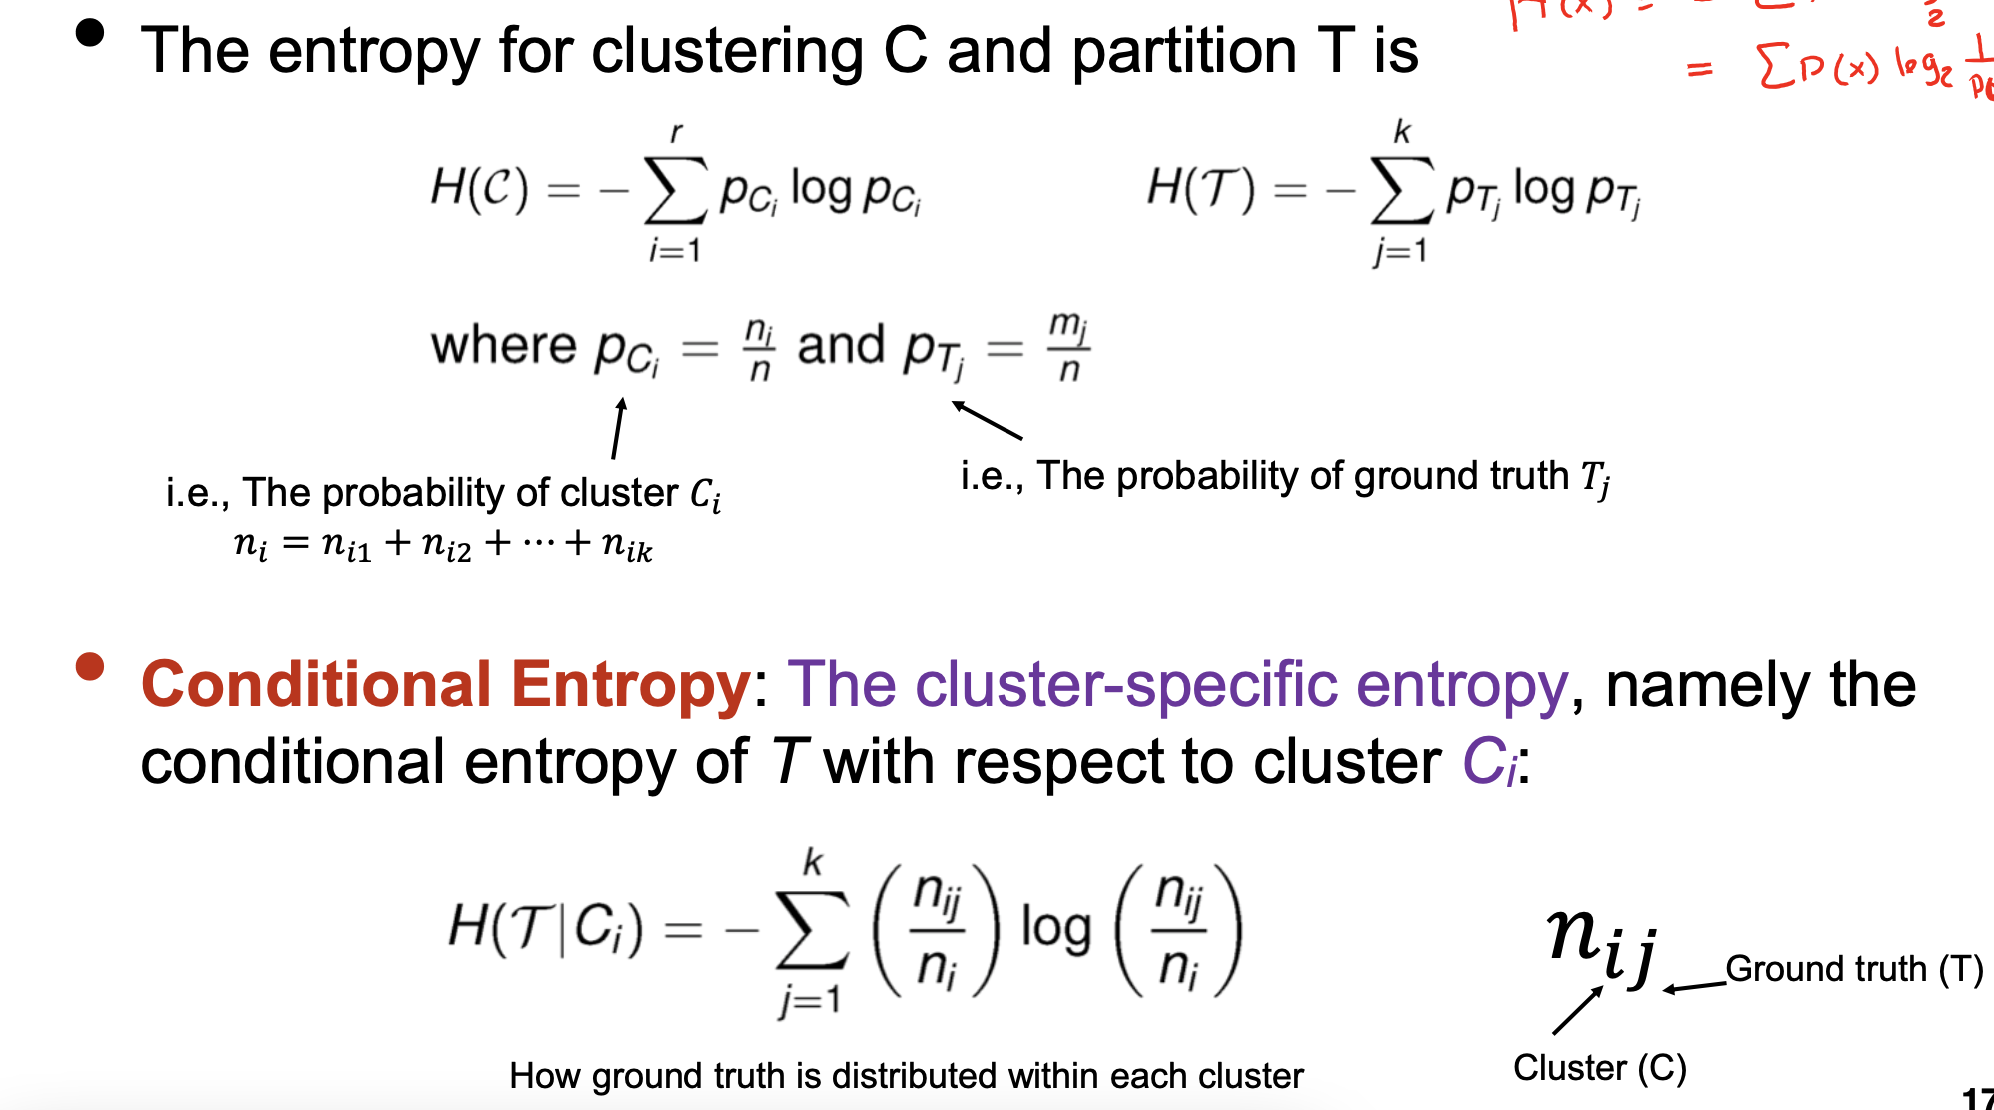
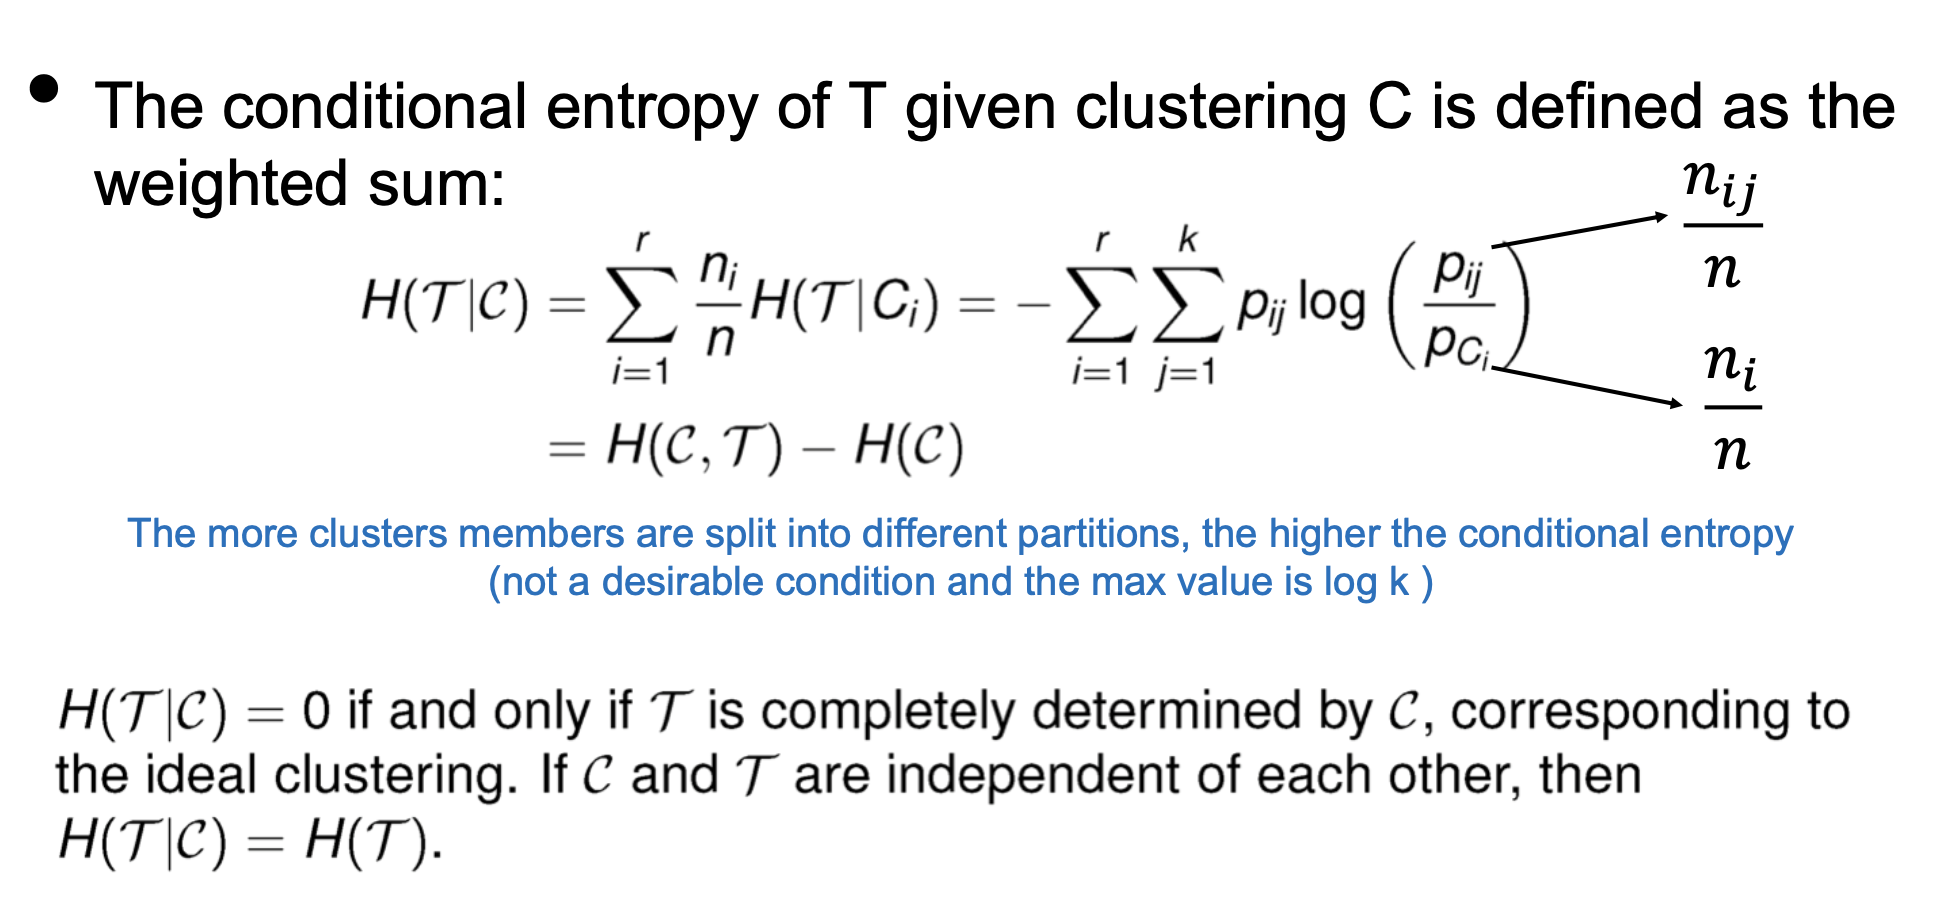
- Conditional Entropy
- Multual Information


Pairwise measures
Internal measures for clustering evaluation
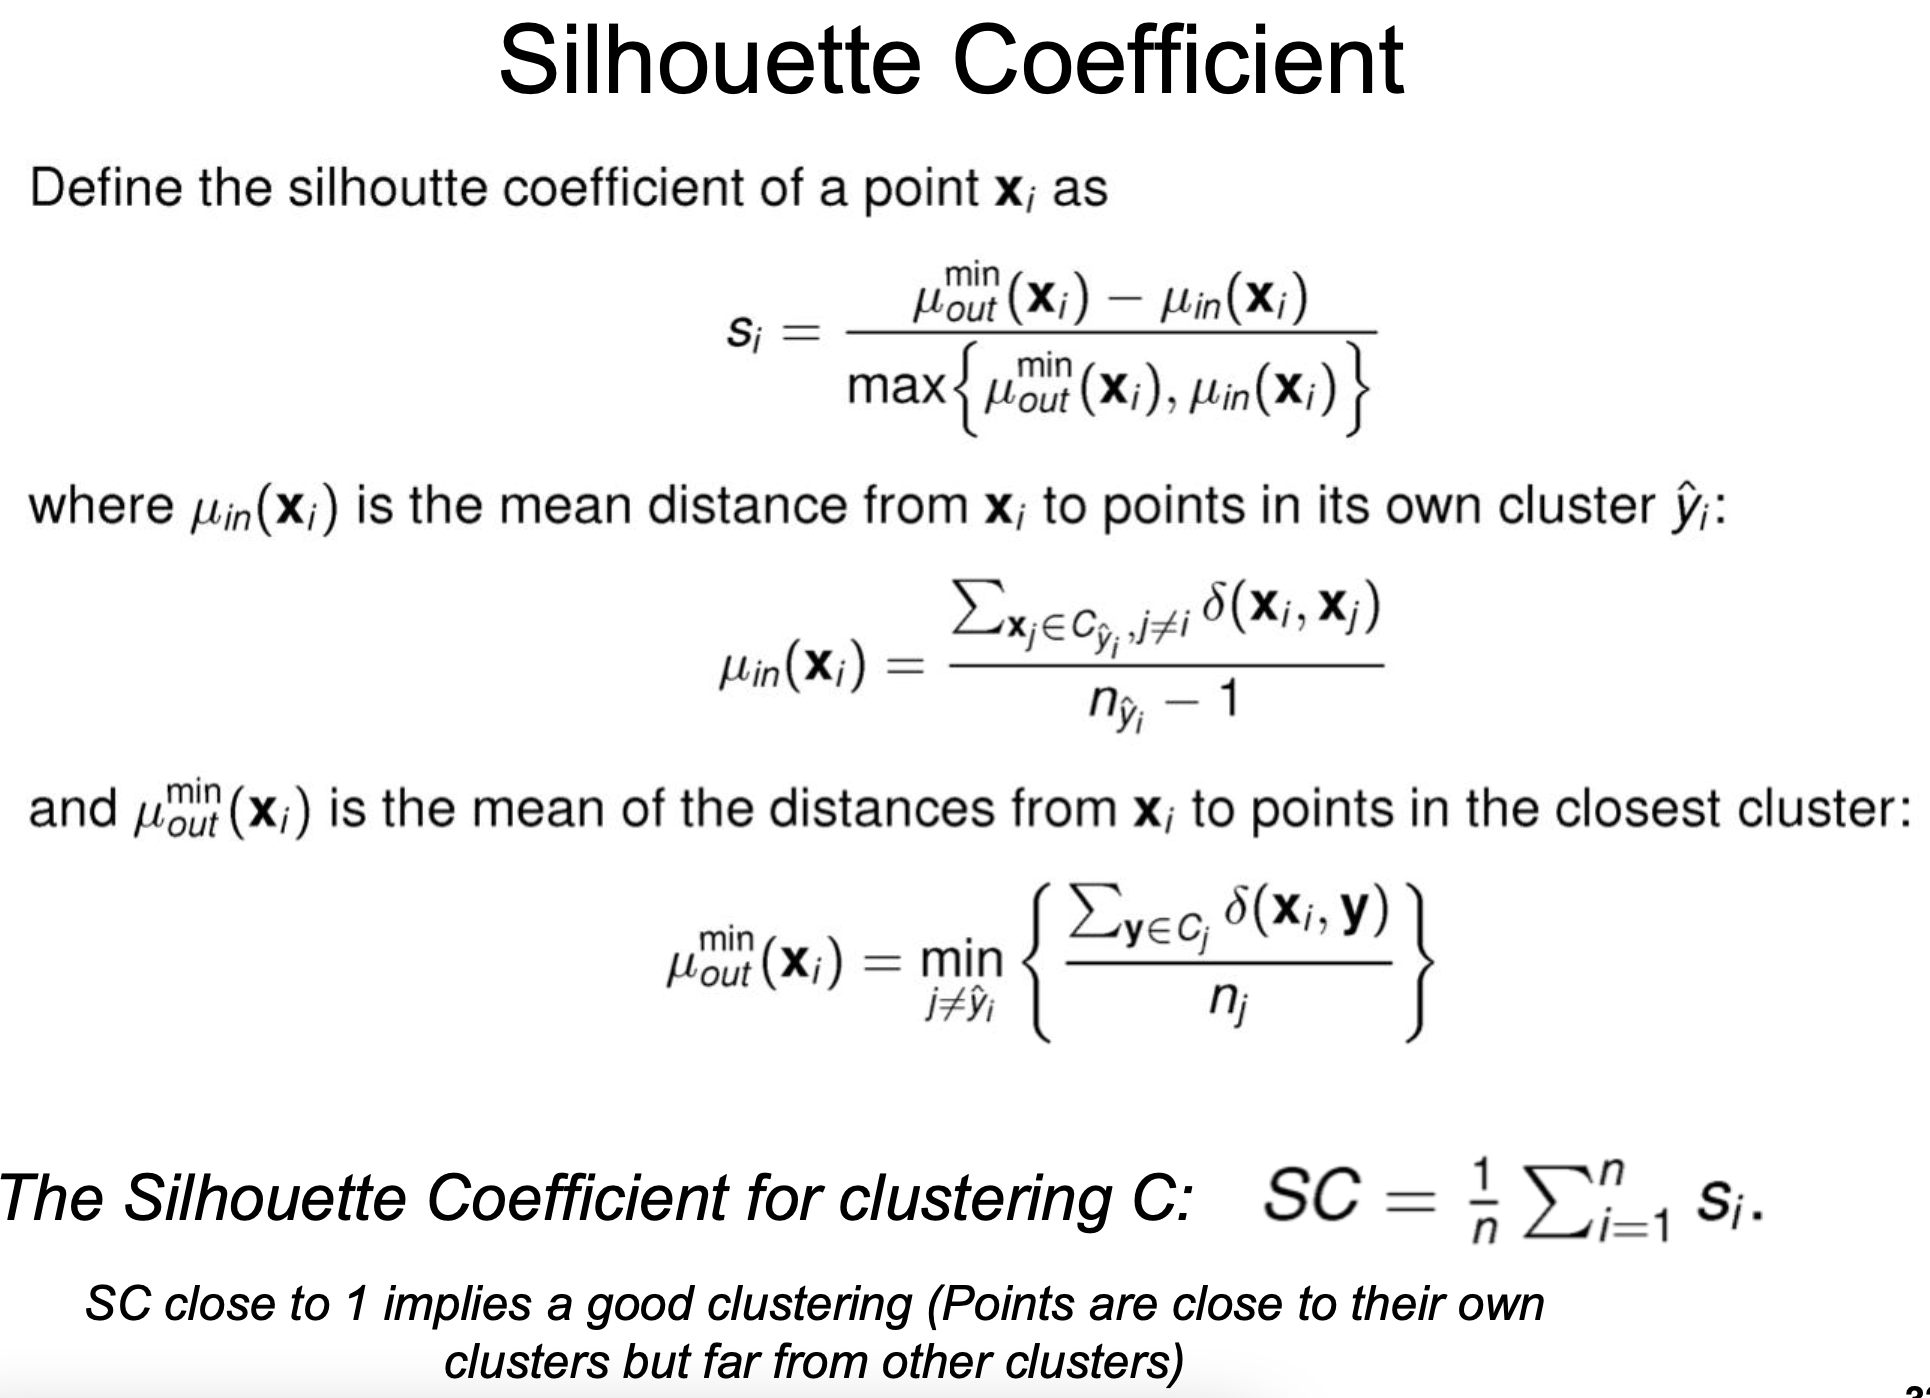
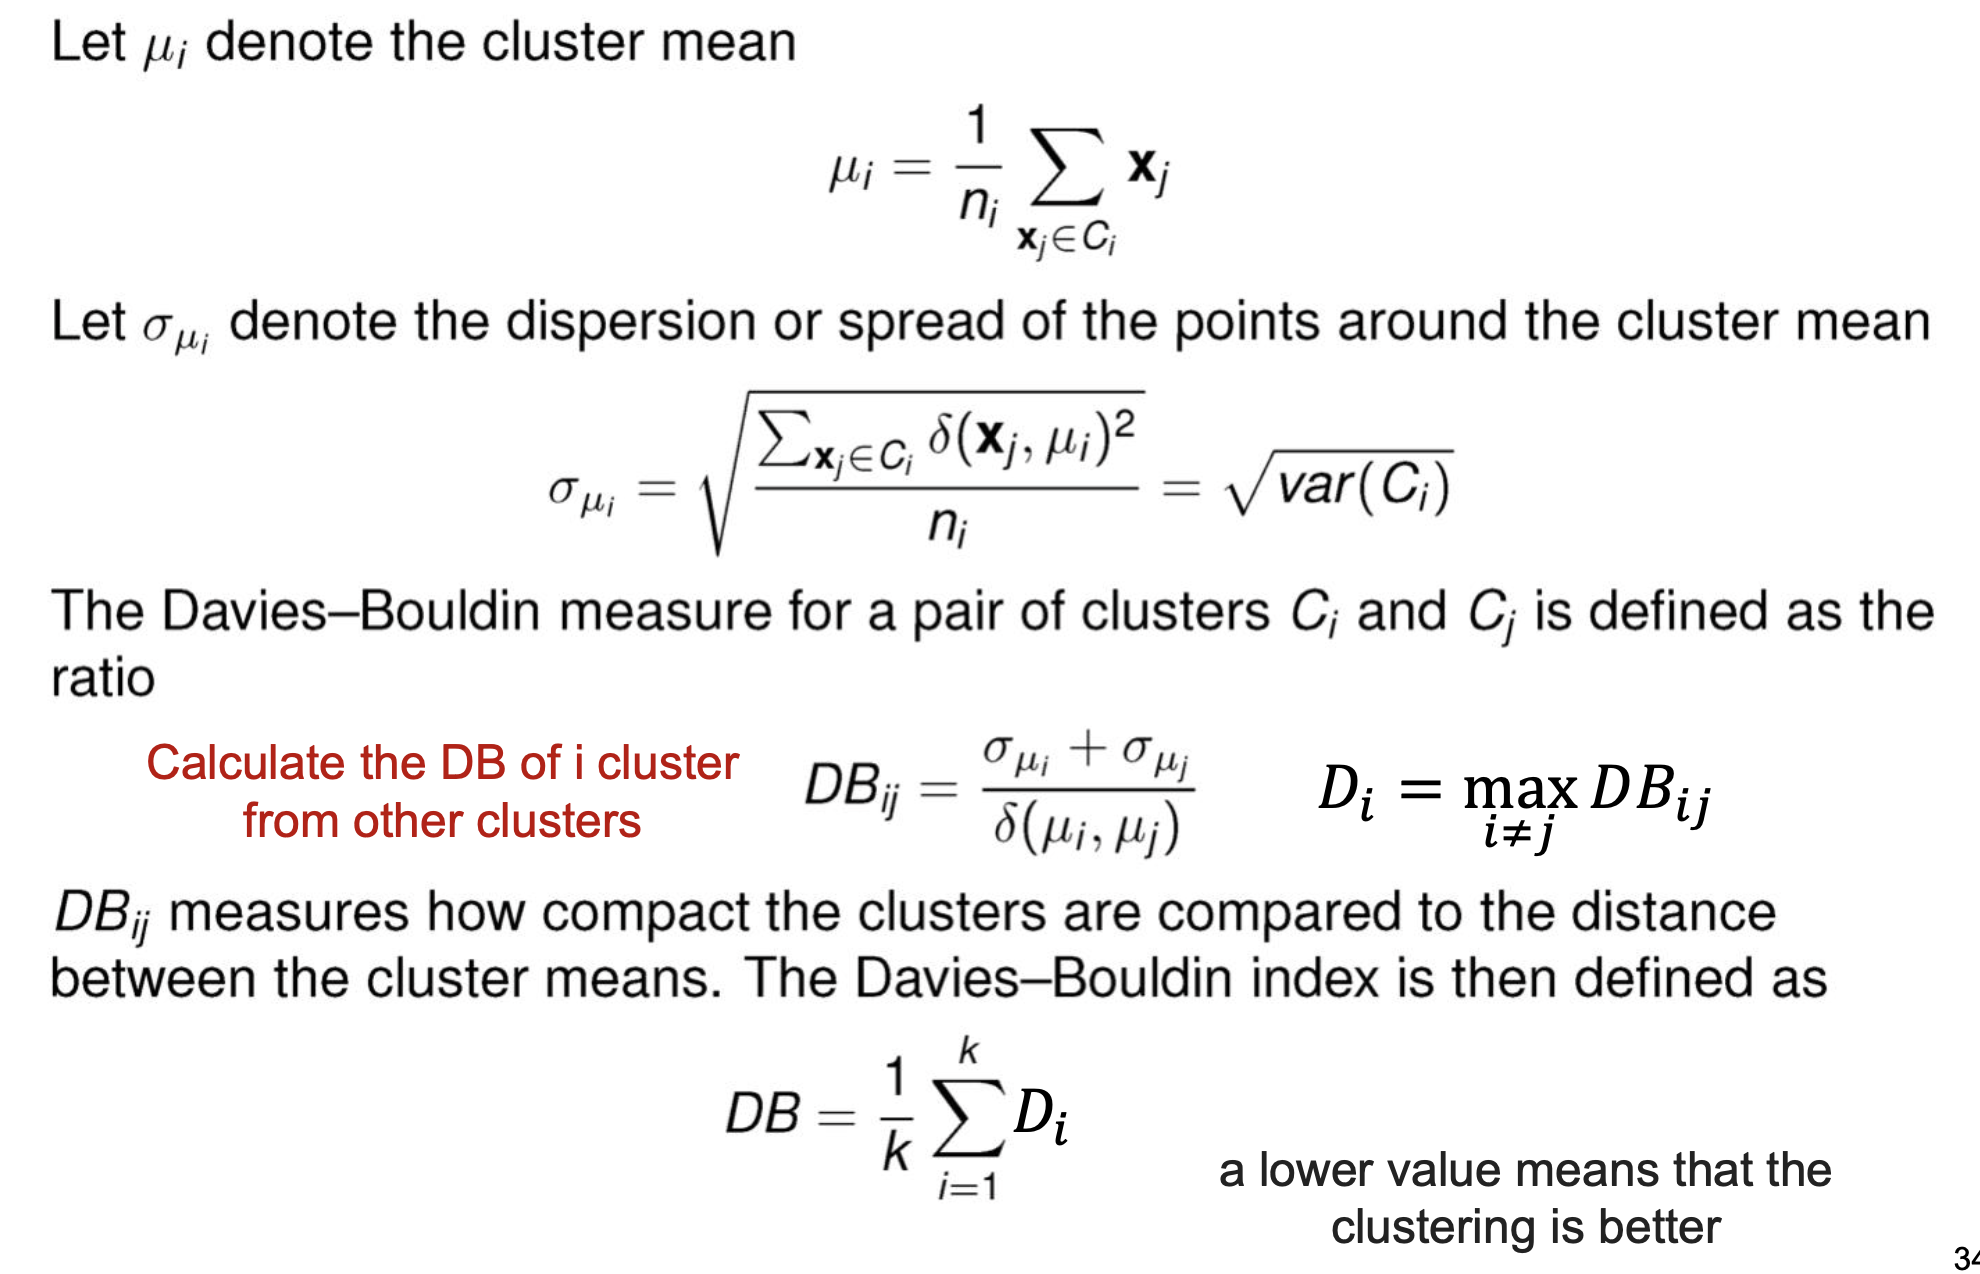
- Internal: No ground truth. Intra-cluster datapoints to be as close as possible to each other and inter-clusters to be as far as possible from each other
Silhouette Coefficient
Davies-Bouldin Index
Graph-based measures
-
Normalized Cut
-
Beta-CV Measure