ATLivingSafe
An interactive safe housing recommendation site, evaluating routes and location safeness.
Overview
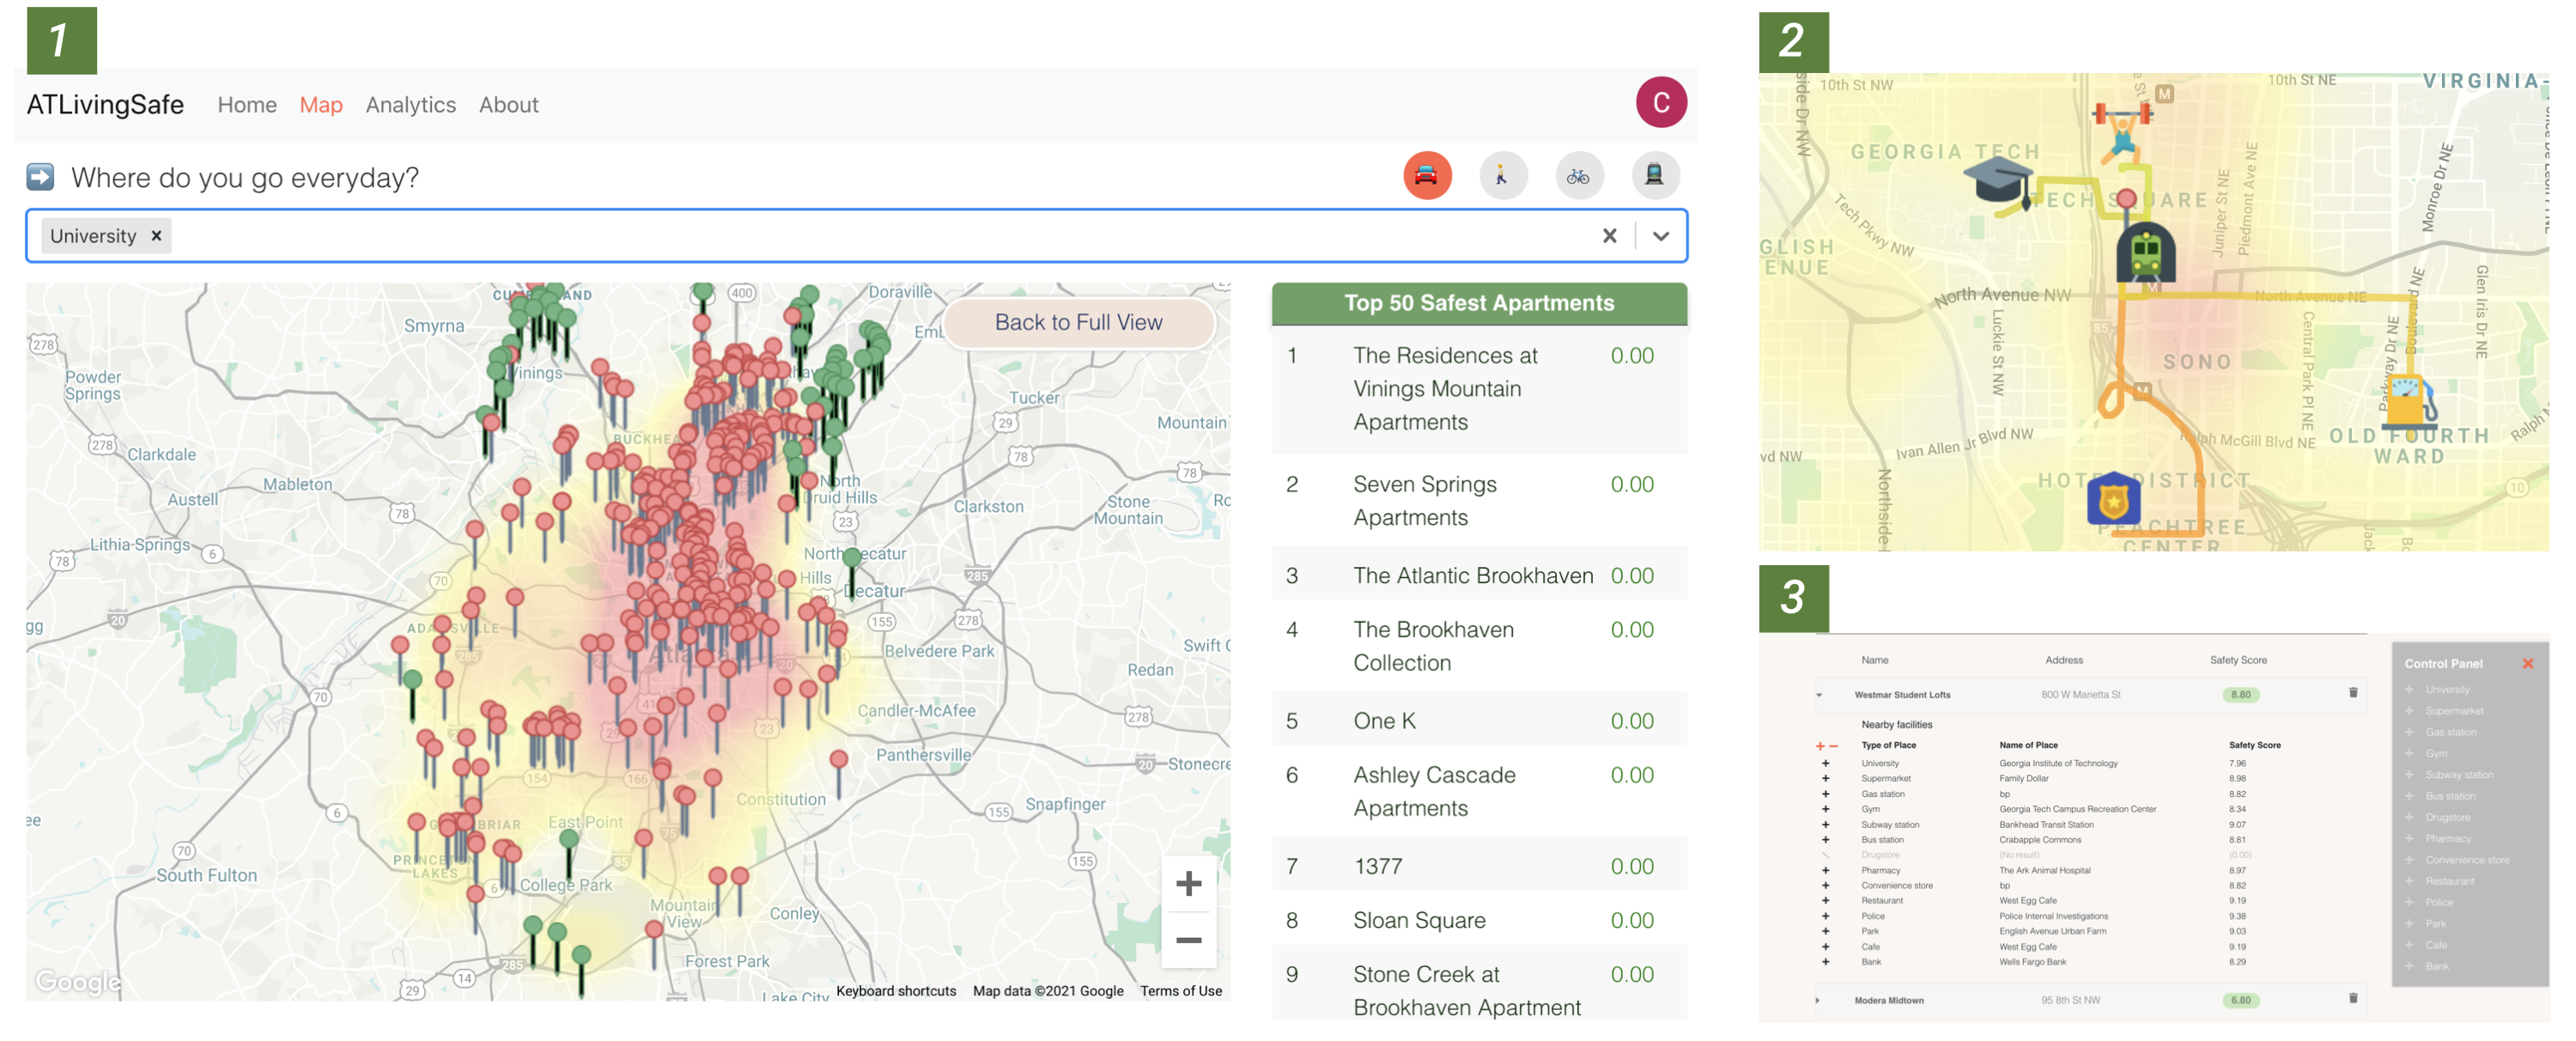
We created a safety-oriented apartment listing site that considers each property listing as a web of routes centered at the apartment and expanding into the wider neighborhood.
This site uses React.js for the frontend, Node.js for the backend, and MongoDB for the database.
See our project here ![]() See the demo video here
See the demo video here ![]()
Innovations
-
We designed a safety-oriented apartment recom- mendation site for students and incorporated the safe- ness of apartment’s surrounding areas and the safeness of their daily routes.
-
We encoded geographical data into grids and built predictive model to evaluate the safeness of each grid, which incorporated the adjacent effects of crime inci- dents and public facilities as well as reduced computa- tional cost.
-
We visualized the safeness of areas and routes as well as the total safety score, which explicitly showed the overall safeness of chosen student apartments.
-
We enabled our users customize their daily visit spots and calculate safety score accordingly.
Methods
We assessed users’ everyday travels from the apartment to areas like universities, stores, and other places while evaluating the safety of a certain unit. Then We constructed a predictive model based on apartment data from online scraping and crime statistics from the previous ten years to calculate a safety score for each grid on the map, then mapped apartments and routes to each grid to arrive at our safety score.
Data
-
Apartment Data.
-
Crime Data. We analyzed the crime data from 2009 to 2021 from the Atlanta Police Department and predicted future crime rate based on time series analysis. We also did exploration data analysis on the crime data.
-
Geographic Data. We collected our geographical data from OpenStreetMap, which contains information of geomorphic characteristics, public transportation, public facilities.
Analytics
- Location Safety Score Evaluation We split the area of Atlanta into 260*280 grids based on longitude and latitude. In order to incorporate adjacent crime incidents for each grid, we applied kernel method on the matrix.
- Route Safety Score Evaluation We computed the safety score of a route and evaluated the safety status by utilizing the waypoints data. To compute the safety score of a route, we add the safety score of all the waypoints on the route.
- Dashboard If the user is logged into our system with a Google account, the apartments they have saved will be stored in our server database and will be displayed when the users open the dashboard under their accounts.
Visualizations
